
Landing Page Conversion Rates for Marketers: 6.6% Median, 10% Target
Across industries, the median landing page converts at about 6.6%, and practitioners often treat 10% as a strong result. Those numbers move a lot by industry, traffic channel, offer type and device. Below we show how the rate is calculated, what ranges to expect, and how to use benchmarks without fooling yourself.
TL;DR:
- Define one conversion event and denominator, then exclude bots, internal visits, and duplicates; session counts cannot be compared fairly with benchmarks based on unique users.
- Report channels separately: email reached a 19.3% median, while 2025 paid social was about 0.4% and paid search about 2.0% to 2.1%.
- Match benchmarks to both offer and buying cycle: SaaS medians were about 3.8%, versus 12.3% for Events and Entertainment, whose offers often prompt quicker decisions.
- For direct sales, price changes expectations: items at $150 or less often convert at 3% to 5%, while purchases of $1,000 or more average around 1%.
- Test one page element at a time, cover weekday patterns, and wait for enough conversions per version; do not stop when one variation briefly leads.
Table of Contents
- Which headline averages should you trust?
- How is landing page conversion rate calculated?
- What do conversion rates look like by industry?
- How does traffic source change expected conversion rates?
- What counts as a good landing page conversion rate?
- Which factors move landing page conversion rates the most?
- How should you use benchmarks without being misled?
- Which landing page optimizations should you test first?
- Why do benchmark reports disagree, and what should you ask?
- How do conversion rates differ between desktop and mobile?
- How much does page load speed affect conversions?
- Do conversion rates change by season or time period?
- How do rates differ by landing page goal?
- Our take: segment first, then test
- How can we help you run faster landing page tests?
- FAQ
- Sources
Which headline averages should you trust?
Published averages disagree, and the gap is mostly methodology. Here are the figures you will meet most often:
- 6.6% median. Unbounce's analysis of 41,000 landing pages, 464 million visitors and 57 million conversions reported this median across industries.
- About 5.89% average. HubSpot's landing page statistics cite this average across industries.
- 10% as a "good" rate. The same HubSpot roundup repeats the practitioner rule of thumb that 10% is a useful target for strong performance.
- Older legacy figure. You will still see older averages quoted on many pages. We treat them as outdated and do not use them as current benchmarks.
A median is the middle page: half convert better, half worse. A mean gets pulled upward by a handful of exceptional pages, so it usually reads higher than the median in skewed data. Sample selection matters too. A dataset of pages built by dedicated landing page tool users skews toward teams that already optimize, while a site analytics dataset includes every page, including neglected ones.
Treat the 10% mark as a target for focused lead generation offers, not a universal pass or fail line.
How is landing page conversion rate calculated?
The formula is simple: conversions ÷ visitors × 100. Say a page gets 4,000 unique visitors and 240 of them submit the form. Whether the denominator is sessions or unique users changes the result, so pick one and keep it.
Most bad benchmark comparisons come from measurement errors, not weak pages. Watch for these:
- Inconsistent conversion definitions. A newsletter signup, a demo request and a purchase are different events and should never share a benchmark.
- Dirty traffic. Bots, internal visits and duplicate sessions inflate the denominator and drag the rate down.
- Small samples. A page with relatively few visitors and conversions can swing wildly from week to week.
- Cross-device journeys. A visitor who reads on a phone and converts on a laptop may be counted as two people, one of whom never converts.
- Session versus user measures. Comparing your session-based rate with a user-based benchmark makes you look worse than you are.
As a rough rule, wait until each variation has collected enough conversions to make a comparison meaningful, and cover weekday patterns when you run the test.
Pro Tip: Write your conversion definition and denominator on the dashboard itself, so every report uses the same math.
What do conversion rates look like by industry?
Industry medians give you a fairer peer group than one headline number. In the Unbounce dataset, SaaS sat near the low end at roughly 3.8%, while Events and Entertainment reached the high end at roughly 12.3%.
- SaaS: about 3.8% median. Longer buying cycles, free trials and demo requests mean many visitors are researching, not buying.
- Events and Entertainment: about 12.3% median. Impulse-friendly offers and a clear date or deadline shorten the decision.
- E-commerce: typically between those extremes. Price is the main lever, as the thresholds section below explains.
- Platform-specific views. Industry KPI datasets such as eMarketer's conversion rate benchmarks break rates out by advertising platform and industry for US activity, which helps when you want a paid-media comparison.
Offer type matters as much as industry. A direct sale lands on a different rate than a lead capture, and a lead capture lands on a different rate than a free trial. Compare your page against peers with the same conversion event and a similar buying cycle, not just the same industry label. A B2B software company running a free ebook offer should not benchmark against its own demo request page, let alone against a retail checkout.
When your industry has no clean published median, build your own baseline from recent data for that offer and use it as the first benchmark.
How does traffic source change expected conversion rates?

Channel often explains more variance than the page itself. The Unbounce data shows email at a median of about 19.3%, far above the cross-industry median, because email audiences already know and trust the sender. Contentsquare's quarterly tracking shows the cold end of the spectrum: paid social converted at roughly 0.4% during 2025, while paid search ran about 2.0 to 2.1% and organic search about 1.7 to 1.8%.
Earlier Contentsquare data tells the same story at a coarser level, with unpaid traffic at about 2.66% against 1.83% for paid. Note that this is site-wide data, not landing-page-only data, so the absolute numbers sit below landing page medians.
- Email: warm audiences, existing intent, highest rates.
- Paid search: the visitor typed a query, so intent is explicit.
- Organic search: similar intent, but a broader mix of informational and buying queries.
- Paid social: interruption-based. People came to scroll, not to buy, so rates run low.
- Direct: often returning visitors and brand-aware buyers.
Never collapse all traffic into one rate. A page can look average overall while converting superbly from email and poorly from paid social, and the fix for each problem is different. Report every channel separately, and compare each one with its own benchmark.
What counts as a good landing page conversion rate?
Use thresholds as triage, not as grades:
- Below 2%: investigate. Check targeting and offer match before redesigning anything.
- 3% to 6%: typical territory for many pages, with room to improve through testing.
- 10% and above: strong, especially for lead generation.
Price shifts the picture. Shopify's guidance notes that low-ticket items of $150 or less often convert at 3% to 5%, medium-ticket items between $150 and $999 at about 2% to 3%, and high-ticket items of $1,000 and up around 1%.
There are exceptions. A page fed by a tiny, highly qualified list can post a huge rate on a small base, and a page with broad cold traffic can post a low one while still producing plenty of revenue per visitor. Judge rate alongside cost per conversion and conversion value.
Before you conclude that an improvement is possible, run a short A/B test on one element. If a clear headline change moves the rate, your page had slack. If nothing moves it, the limit is probably the audience or the offer.
Which factors move landing page conversion rates the most?
Audit these roughly in this order:
- Offer relevance: does the page deliver what the ad or link promised?
- Page speed: slow pages lose visitors before they read a word.
- Headline clarity: a visitor should grasp the value in a few seconds.
- CTA prominence: one clear primary action beats several competing ones.
- Form friction: every extra field costs completions.
- Social proof: reviews, logos and specific results reduce doubt.
- Mobile experience: thumb-friendly layouts and readable text.
- Targeting quality: the right people matter more than any design tweak.
These factors interact. A beautifully designed page with mismatched targeting still underperforms, and a perfect audience will bounce off a page that takes a long time to load. That is why fixing the weakest link usually beats polishing the strongest one. For more design-side detail, see our guide to designing effective landing pages.
Pro Tip: Watch the step where most visitors leave. If they leave before scrolling, suspect the headline or speed. If they scroll but never click, suspect the offer or CTA. If they start the form and quit, suspect the fields.
How should you use benchmarks without being misled?
Benchmarks are a starting hypothesis. Apply them in this order:
- Segment first. Split results by channel, device, campaign and offer before comparing anything to a published number.
- Match the conversion event. Compare demo requests with demo requests, not with downloads.
- Respect sample size. Aim for enough conversions per variation to make a meaningful comparison, and do not stop a test the moment one version pulls ahead.
- Separate statistical from practical significance. A tiny lift can be statistically real yet too small to justify the engineering time. Decide in advance what lift is worth shipping.
- Keep a control. Without a control group, seasonality and traffic changes will masquerade as improvements.
Our complete guide to A/B testing for landing pages walks through setup and interpretation if you want the full process.
Which landing page optimizations should you test first?
Work down this list, since the earlier items usually deliver bigger swings:
- Headline and promise match. Hypothesis: mirroring the ad's wording in the headline raises conversions. Measure the rate for that traffic source.
- CTA clarity and placement. Replace vague labels like "Submit" with the outcome ("Get my free audit"). Our partner's guide on crafting effective CTAs has tactical examples.
- Fewer form fields. Cut every field you do not use in the first follow-up. Track completion rate as well as lead quality.
- Speed. Compress images and trim scripts, then watch bounce rate and conversions together. See improving landing page performance.
- Mobile-first layout. Test a single-column layout with a sticky button.
- Trust indicators. Add a named testimonial or a specific result near the CTA.
Run one test at a time per page, keep each live long enough to cover normal variations in traffic, and wait for enough conversions before calling a winner. More ideas are in our list of 10 A/B testing ideas for landing pages, and copy-focused changes are covered in landing page copywriting.
Pro Tip: Log every test with its hypothesis, dates, traffic and result. After a few months that log becomes your own, far more relevant benchmark.
Why do benchmark reports disagree, and what should you ask?
Reports differ because they measure different things. The Unbounce figure comes from 41,000 landing pages and 464 million visitors and reports a median. HubSpot's roundup reports an average. Contentsquare tracks whole-site behavior quarter by quarter, so its rates are lower and not directly comparable to page-level figures. Date ranges differ as well, and a Q4 holiday window will not match a full-year view.
Before you rely on any report, check these:
- Sample size: how many pages and visitors sit behind the number?
- Industry labels: how were pages assigned, and is yours a fair match?
- Channel breakdowns: does the report split email, search and social?
- Conversion definition: what counted as a conversion?
- Statistic type: median or mean, and over which dates?
If a report cannot answer these, use it only as loose context. Never apply a single number to your page without checking all five.
How do conversion rates differ between desktop and mobile?
Mobile usually brings the larger share of traffic but the lower conversion rate. People browse on phones during commutes and breaks, then complete purchases or long forms on larger screens. That is the cross-device problem again: a mobile visit may seed a conversion that gets credited to desktop. Our sources here do not give a clean landing-page-specific split by device, so we will not quote one. Measure your own.
What to do about it:
- Segment every report by device. A blended rate hides the fact that one device may be broken.
- Compare desktop with desktop. When you use benchmarks, make sure the dataset is not mostly one device.
- Shorten mobile forms. Fewer fields, the right keyboard type per field and autofill support all reduce friction.
- Make the CTA reachable. A large, sticky button within thumb range beats a small link at the bottom.
- Check legibility. Text that requires pinching to read loses people quietly.
If mobile traffic is large but converts poorly, treat that as a top-priority test area. Our guide to designing effective landing pages covers mobile layout choices. A modest mobile lift often changes total results more than a big desktop win simply because of volume.
How much does page load speed affect conversions?
Speed works as a gate: visitors who never see the page cannot convert. A slow load raises bounce rates, which shrinks the pool of people who ever reach your headline and CTA. The effect is rarely visible in a benchmark table, because benchmark datasets do not control for it, but it shows up clearly in your own before-and-after tests. We do not have a sourced figure for the exact lift per second saved, so treat any "each second costs X%" claim you read elsewhere with caution unless the study is named.
Where to look first:
- Images. Oversized hero images are the most common culprit. Compress them and use modern formats.
- Scripts. Every tracking pixel, chat widget and testing tool adds weight. Audit what you really use.
- Fonts and embeds. Custom fonts and embedded videos can delay first paint.
- Testing tools. Heavy A/B testing scripts can flicker or slow a page, which hurts the very metric you are testing. We built our own testing script to be light for this reason.
- Hosting and caching. A fast server and a CDN help every visitor.
Test speed fixes like any other change: record load time and conversion rate before, ship the fix, and compare against a control period of the same length and traffic mix. Our article on improving landing page performance lists step-by-step fixes.
Do conversion rates change by season or time period?
Yes, and you should plan for it. Contentsquare's Q4 2024 analysis found overall conversion rates declined 6.1% year over year, and its Q4 2025 tracking showed another 5.1% drop. Two things follow. Time period shapes the numbers, and a single quarter's figure is a snapshot, not a constant. The Unbounce benchmark likewise draws on Q4 2024 data, a busy holiday quarter that may not represent your own calendar.
Practical habits:
- Compare like periods. Judge this November against last November, not against October.
- Know your calendar. Retail, travel, education and B2B each peak at different times. Budget cycles and holidays change buyer intent.
- Account for day of week. Weekday and weekend behavior often differ, which is why tests should run in full-week blocks.
- Watch traffic mix. A seasonal surge of cold paid traffic can lower your blended rate while your best channels stay steady.
- Do not read noise as a trend. One weak week is not a redesign signal.
When a season distorts your data, lean on controlled A/B tests. Both versions face the same conditions at the same time, so seasonality cancels out of the comparison.
How do rates differ by landing page goal?
The conversion event sets the ceiling. A low-commitment ask, such as joining a newsletter or downloading a checklist, converts far more easily than an ask that costs money or time. Roughly, expect this order from easiest to hardest:
- Sign-ups and downloads: low commitment, the highest rates of the group.
- Lead generation (demo, quote, consultation): moderate commitment, moderate rates.
- Direct sales: the highest commitment, and price drives the result. As noted earlier, low-ticket items often convert at 3% to 5% while high-ticket items sit near 1%.
The "10% is good" rule of thumb from HubSpot's statistics roundup fits lead capture far better than high-ticket sales.
This is also why the industry gap exists. SaaS pages, often asking for demos or trials, sit near 3.8%, while lower-commitment event offers reach about 12.3%.
Three habits keep comparisons honest. Benchmark each page against pages with the same goal. Track micro-conversions (clicks to the form, form starts) when the main event is rare. And track downstream quality, because a form with fewer fields may raise lead volume while lowering the share of leads that become customers.
Our take: segment first, then test
The headline numbers are a starting point. Then let experiments decide. Benchmarks are directional; your own controlled tests are the final word on what works for your audience.
— Juan
How can we help you run faster landing page tests?
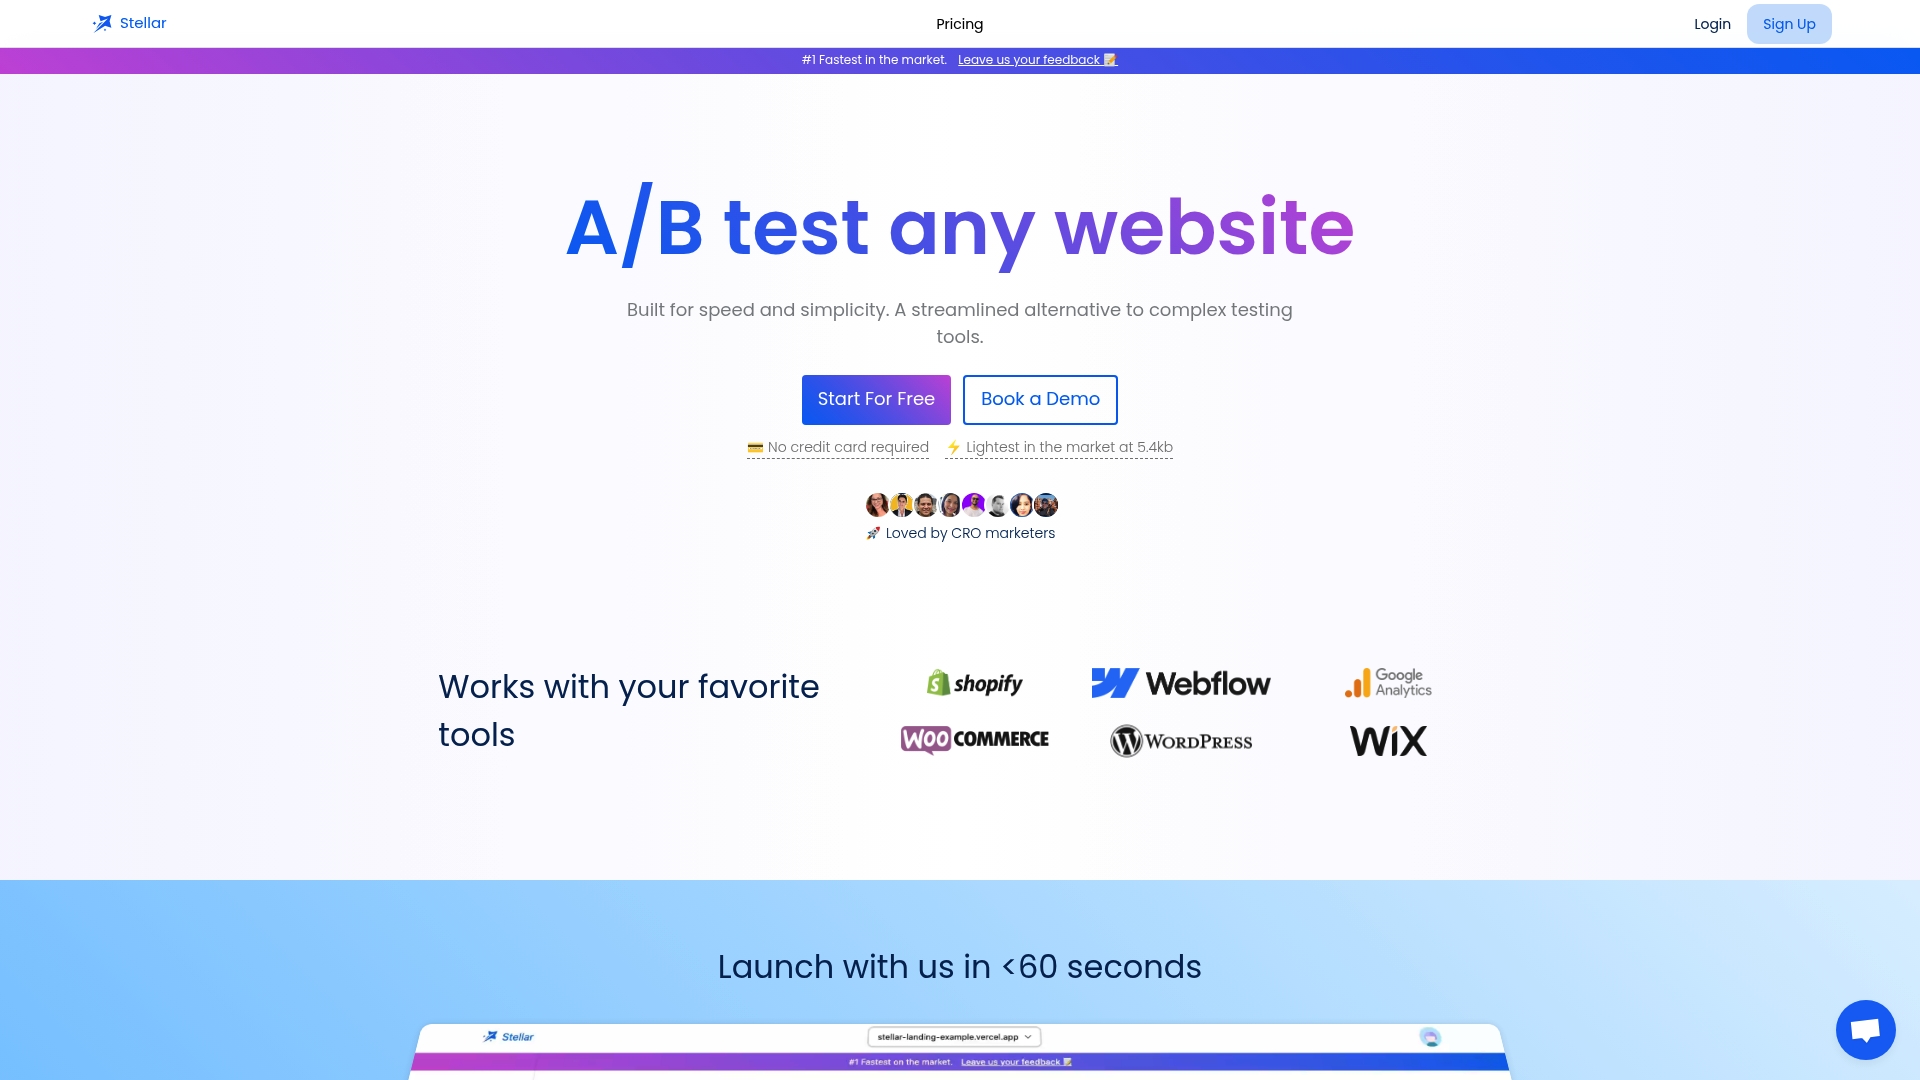
Everything above comes down to running clean tests quickly, and that is what we built our A/B testing platform for. A few facts about how it fits:
- Lightweight script: the script is designed to keep testing from slowing down the page you are measuring.
- No-code visual editor: change headlines, buttons and layouts without waiting on a developer.
- Goal tracking and real-time analytics: see which variation wins on the conversion event you defined.
- Free entry point: the Sandbox plan costs $0 per month for small sites.
It will not fix a weak offer, but it makes the tests recommended in this article faster to launch and easier to read. Start a free test on your highest-traffic landing page this week.
FAQ
What is a good conversion rate for a landing page?
The right target depends on your industry, channel and price point, so compare against peers with the same conversion event. HubSpot's landing page statistics repeat the 10% benchmark.
What is a good CTR on a landing page?
Click-through rate on a landing page usually means the share of visitors who click your main call to action. We do not have a sourced benchmark for it, and it varies widely with offer and channel. Track your own baseline, then test button copy and placement to improve it.
Is a 30% conversion rate good?
It is exceptionally high compared with cross-industry medians, but it is possible on warm traffic. Email, for instance, has a median near 19.3% in the Unbounce dataset. Check the traffic source and conversion event before celebrating, and confirm the sample is large enough.
Is a 25% conversion rate good?
Yes, in most cases. It is most believable on low-commitment offers or email audiences, so verify that your measurement counts unique visitors and genuine conversions.
Sources
- Does Your Landing Page Conversion Rate Measure Up? - Marketing Charts
- Landing Page Conversion Rate: Benchmarks and How To Improve (2025) - Shopify
- 16 Landing Page Statistics For Businesses - HubSpot Blog