
E Commerce Analytics: Drive Sales With Data in 2026
TL;DR:
- Ecommerce analytics involve collecting and interpreting store data to boost revenue and customer engagement. Mastering all four analysis layers helps stores make better decisions and scale effectively. Tracking nine key KPIs and conducting causal analysis are essential for making profitable, data-driven choices.
E-commerce analytics is the systematic process of collecting, measuring, and interpreting online store data to make decisions that grow revenue and improve customer engagement. Most store owners track surface-level numbers like page views and platform ROAS, but those metrics rarely connect to profit. The four layers of ecommerce data analytics, which are descriptive, diagnostic, predictive, and causal, give you a complete picture. Causal analysis is the layer that tells you why revenue changed, not just that it changed. Mastering all four is what separates stores that scale from stores that stall.
What are the key metrics and KPIs for e commerce analytics?
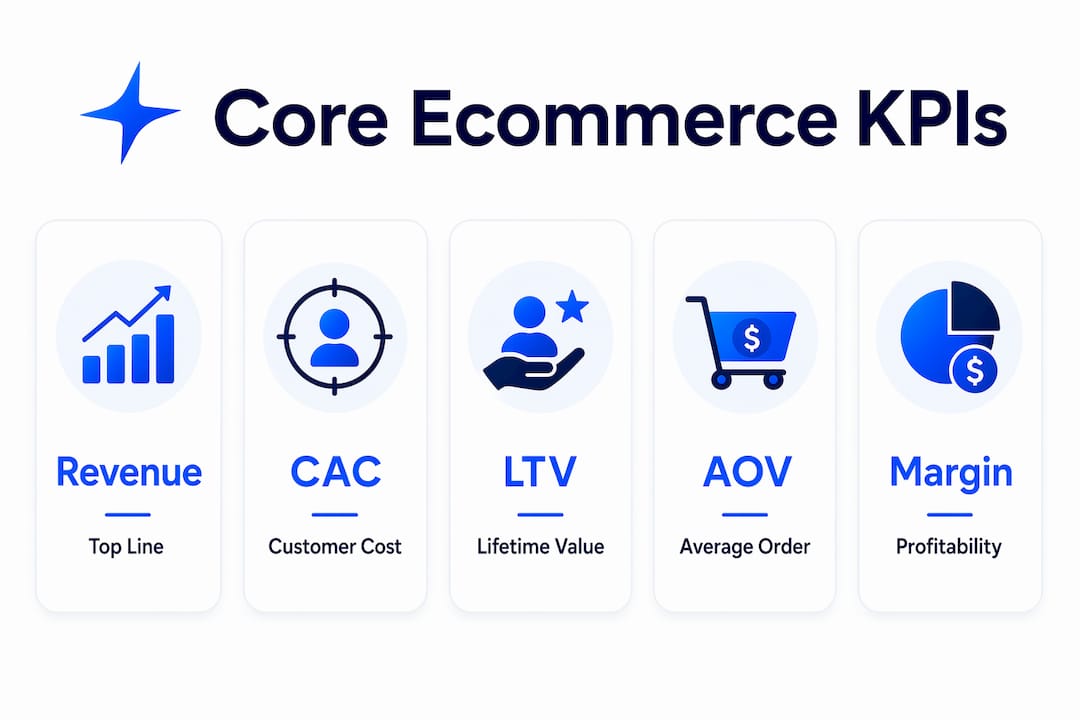
The right metrics tell you where your business is healthy and where it is bleeding. Nine core KPIs capture 90% of business insight for Shopify SMBs when tracked weekly: revenue, contribution margin, customer acquisition cost (CAC), lifetime value (LTV), average order value (AOV), repeat purchase rate, ROAS, conversion rate, and inventory weeks-of-cover. That list is short by design. Tracking too many metrics overwhelms operators and dilutes focus.
Each KPI has a specific job. Revenue tells you the top line. Contribution margin tells you what you actually keep after variable costs. CAC and LTV together tell you whether your acquisition model is sustainable. A business with a CAC of $40 and an LTV of $38 is losing money on every customer, regardless of how strong its ROAS looks on paper.
| KPI | What it measures | Why it matters |
|---|---|---|
| Contribution margin | Revenue minus variable costs | Shows true profitability per order |
| CAC | Cost to acquire one customer | Determines acquisition sustainability |
| LTV | Total revenue from one customer | Justifies long-term ad spend |
| Repeat purchase rate | % of customers who buy again | Signals loyalty and retention health |
| Inventory weeks-of-cover | Stock relative to sales velocity | Prevents stockouts and overbuying |
Retailers who focus on profit-linked KPIs consistently outperform those chasing vanity metrics like impressions or platform-reported ROAS. Platform ROAS is calculated by the platform selling you ads. It has a structural incentive to look good.
Pro Tip: Set up a weekly KPI dashboard that pulls live data from your store, ad accounts, and accounting software. Stale data creates false confidence. A number that is three days old during a sale event is useless.

Tracking essential marketing KPIs alongside your store metrics gives you a full view of where traffic quality is rising or falling before it shows up in revenue.
How does layered data analysis improve ecommerce decision-making?
Most analytics tools stop at the first two layers of analysis. Descriptive analysis answers "what happened?" Diagnostic analysis answers "where did it happen?" Both are useful. Neither tells you what to do next with any confidence.
The four layers work like this:
- Descriptive: Revenue was down 18% last week.
- Diagnostic: The drop came from paid search, not organic or email.
- Predictive: Based on current trends, next month will also underperform.
- Causal: The revenue drop was caused by a landing page change, not ad spend reduction.
The jump from diagnostic to causal is where most store owners get stuck. They see a correlation, assume causation, and make budget decisions based on a guess. Confusing correlation with causation is the most common and costly mistake in ecommerce performance tracking. A store that cuts its Google Ads budget because revenue dropped, when the real cause was a broken checkout flow, has now compounded one problem with another.
Causal analysis estimates the counterfactual revenue that would have occurred without a change. That counterfactual is what makes a budget decision defensible. Without it, you are spending based on a feeling dressed up as a data point.
Incrementality testing is the practical tool for causal analysis. You run a controlled experiment, hold out a segment of your audience from a campaign, and measure the difference in revenue between the exposed and unexposed groups. The gap is your true incremental lift. This method works for email campaigns, paid social, and even promotional discounts.
Pro Tip: Before shifting any budget above $5,000 per month, run an incrementality test or a geo-based holdout experiment. The cost of the test is almost always lower than the cost of a wrong decision.
Which tools support effective ecommerce data analysis?
A functional analytics stack for an SMB typically includes four components: a store platform like Shopify, a web analytics tool like Google Analytics 4 (GA4), advertising platforms like Meta and Google Ads, and an accounting tool like QuickBooks or Xero. Each platform reports data differently. That is where the problems start.
Integrating Shopify, GA4, Meta, and accounting data into a single unified view reduces manual reconciliation time and improves KPI accuracy. Without integration, operators spend hours each week copying numbers between spreadsheets, and those numbers rarely agree. Shopify revenue and GA4 revenue almost never match exactly because of how each platform counts transactions.
The solution is standardizing your definitions before you build any report. Decide what "revenue" means in your business. Is it gross revenue, net of returns, or net of discounts? Apply that definition consistently across every platform. Then build a reconciliation template that flags discrepancies automatically.
- Connect your Shopify store to GA4 using the official Google and YouTube channel integration and verify that purchase events fire correctly on every order confirmation page.
- Pull ad spend data from Meta and Google Ads into a single reporting layer, either a data warehouse or a structured spreadsheet, using platform APIs or a connector tool.
- Map your accounting categories to your ad platform categories so that contribution margin is calculable without manual adjustments.
- Set up automated alerts for data anomalies, such as a sudden drop in GA4 purchase events, which often signals a tracking break rather than a real sales decline.
Pro Tip: Build a GA4 purchase-event QA checklist and run it every time you update your site theme or checkout flow. Tracking breaks are silent. You will not know your data is wrong until you are making decisions on bad numbers.
How can analytics drive conversion rate optimization?
Conversion rate optimization (CRO) is the practice of increasing the percentage of visitors who complete a purchase, without spending more on traffic. CRO increases revenue by improving what happens after a visitor lands on your site, which means every gain compounds against your existing traffic volume. A 1% conversion rate increase on 10,000 monthly visitors produces 100 additional conversions at zero additional acquisition cost.
The average landing page conversion rate sits between 2% and 5%. Top-performing pages regularly hit 5–15%. That gap is not luck. It is the result of systematic testing informed by behavioral data.
Analytics informs CRO in three specific ways:
- Heatmaps and session recordings show where visitors stop scrolling, where they click, and where they abandon. This tells you which page elements are creating friction before you run a single test.
- Funnel analysis identifies the exact step where the most visitors drop off. A 60% drop at the cart page points to a different fix than a 60% drop at the checkout payment step.
- A/B testing validates whether a proposed change actually improves conversion or just looks better to the person who designed it.
Prioritizing which tests to run matters as much as running them. The EPIC framework, which stands for Experiment value, Priority, Impact, and Cost, helps teams rank CRO experiments by expected return before committing resources. High-volume, high-friction pages get tested first. Low-traffic pages with minor friction get deprioritized.
Proven CRO tactics like simplifying the checkout flow, adding trust signals near the buy button, and improving site search all produce measurable lifts when validated through testing. The key word is "validated." An opinion about what will convert better is not a CRO strategy. A tested hypothesis with a clear success metric is.
Gostellar's A/B testing platform supports this process with a no-code visual editor and real-time analytics, so you can run experiments without waiting on a developer. The 5.4KB script size means tests run without slowing your store, which matters because page speed is itself a conversion factor.
Key Takeaways
Effective ecommerce analytics requires tracking the right KPIs, applying causal analysis, maintaining data hygiene, and running systematic CRO tests to convert existing traffic into revenue.
| Point | Details |
|---|---|
| Track nine core KPIs | Revenue, CAC, LTV, AOV, and contribution margin cover 90% of business insight needs. |
| Use causal analysis | Identify what truly drives revenue changes before shifting any marketing budget. |
| Unify your data stack | Integrate Shopify, GA4, and ad platforms to eliminate manual reconciliation errors. |
| Prioritize CRO tests | Use the EPIC framework to focus testing resources on the highest-impact pages first. |
| Avoid vanity metrics | Platform ROAS and impressions do not connect to profit. Focus on margin-linked KPIs. |
Why most stores are still just reporting, not deciding
The most common analytics failure I see is not a tool problem. It is a mindset problem. Store owners pull a weekly report, see that revenue is up or down, and treat that number as the conclusion. It is not the conclusion. It is the starting question.
Real analytics work begins after the number. You ask why revenue changed. You isolate the variable. You test whether your explanation holds up under a controlled experiment. That process feels slow when you are used to making decisions by instinct, but it is the only way to build a store that grows predictably rather than accidentally.
The stores I have seen scale past seven figures consistently share one habit: they measure before they act, and they act on what they measured. They do not chase trends. They run experiments, read the results, and update their assumptions. That feedback loop, measure, decide, act, and measure again, is what turns analytics from a reporting exercise into a growth engine.
AI-driven analysis tools are making this faster. You can now get plain-English answers to complex data questions without writing a single SQL query. That removes the bottleneck between data and decision for operators who are not data scientists. The technology is not the barrier anymore. The barrier is the willingness to ask harder questions of your data.
— Juan
How Gostellar connects your analytics to real decisions
Running experiments without reliable data is like testing a recipe without tasting the food. Gostellar gives e-commerce teams the A/B testing infrastructure to act on what their analytics reveal, with a no-code visual editor, real-time results, and goal tracking built for ecommerce that ties test outcomes directly to revenue metrics.

The platform's 5.4KB script keeps your store fast while tests run, so you are not trading conversion rate improvements for page speed losses. Gostellar's free plan covers stores with under 25,000 monthly tracked users, making it accessible for SMBs that are serious about testing but not ready for enterprise pricing. If your analytics are telling you what to fix, Gostellar gives you the fastest way to test whether your fix actually works.
FAQ
What is e-commerce analytics?
E-commerce analytics is the practice of collecting and analyzing online store data to make decisions that improve sales, customer behavior, and profitability. It covers metrics like conversion rate, CAC, LTV, and contribution margin.
Which KPIs should e-commerce businesses track weekly?
Nine KPIs cover 90% of business insight for most SMBs: revenue, contribution margin, CAC, LTV, AOV, repeat purchase rate, ROAS, conversion rate, and inventory weeks-of-cover.
What is causal analysis in ecommerce?
Causal analysis identifies what actually caused a revenue change, as opposed to what merely correlated with it. It uses methods like incrementality testing to produce defensible budget decisions.
How does conversion rate optimization relate to analytics?
CRO uses behavioral data from analytics, including heatmaps, funnel reports, and A/B test results, to increase the percentage of visitors who buy without increasing traffic spend.
Why do Shopify and GA4 revenue numbers differ?
Shopify and GA4 count transactions differently, particularly around refunds, discounts, and session attribution. Standardizing your revenue definition and running regular QA checks on GA4 purchase events resolves most discrepancies.
Recommended
Published: 7/9/2026