
Interpreting A/B Test Data to Drive Smarter Decisions
Over half of american businesses rely on A/B testing to shape digital decisions, yet many struggle with turning raw data into actionable results. Getting the process right makes a real difference in user engagement and revenue. This guide takes you through each step of the A/B testing workflow, showing how to prepare, analyze, and implement changes that actually drive smarter outcomes.
Table of Contents
- Step 1: Prepare Your A/B Test Data for Analysis
- Step 2: Identify Key Performance Indicators and Metrics
- Step 3: Analyze Statistical Significance and Reliability
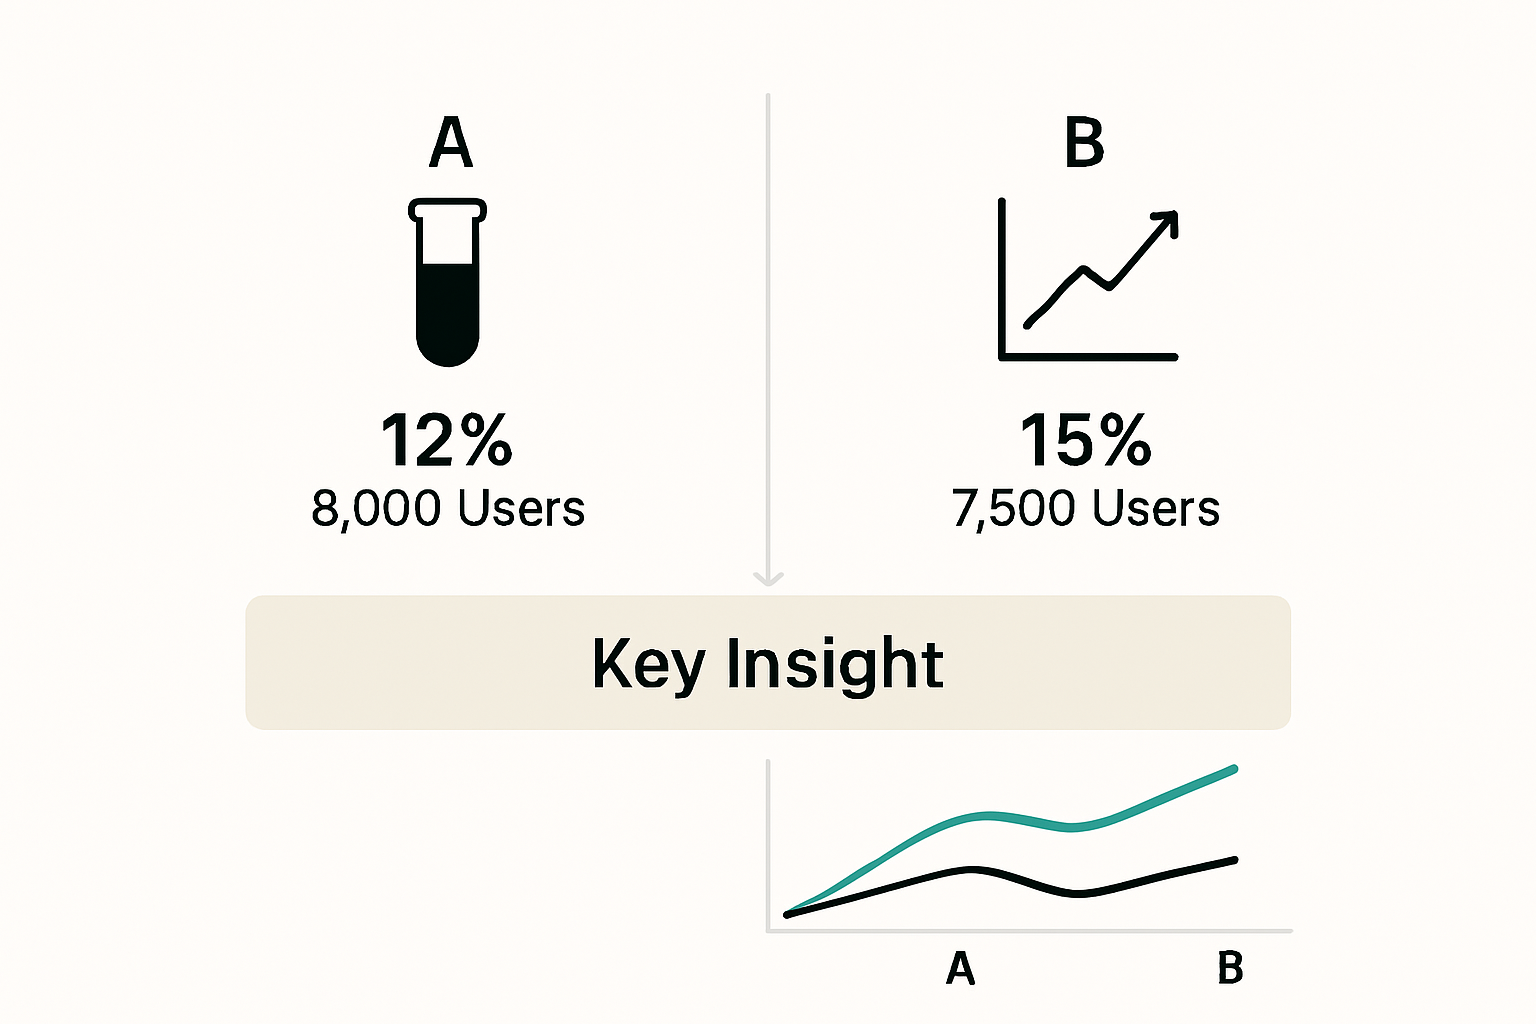
- Step 4: Compare Variation Results to Draw Insights
- Step 5: Validate Outcomes and Implement Winning Changes
Quick Summary
| Key Insight | Explanation |
|---|---|
| 1. Prepare Your A/B Test Data | Organize data into clear formats to ensure accuracy in analysis and insights. |
| 2. Select Relevant KPIs | Focus on metrics linked to your business goals that reflect user behavior changes. |
| 3. Establish Statistical Significance | Determine meaningful differences in variations using p values and confidence intervals. |
| 4. Compare Variation Results | Systematically analyze variations to uncover patterns and insights that guide decisions. |
| 5. Validate and Implement Changes | Use analytics for informed implementations, monitoring post-launch for real-world impact. |
Step 1: Prepare your A/B Test Data for Analysis
Successful A/B testing hinges on meticulous data preparation. Your goal here is to organize and structure the data collected during your experiment, ensuring clean and reliable information for meaningful insights. By systematically preparing your test results, you'll set the foundation for accurate statistical analysis and smart decision making.
Begin by creating a comprehensive spreadsheet that captures all key variables from your experiment. MIT recommends establishing a structured logging system that tracks each interaction precisely. This means recording specific metrics like user actions, conversion rates, timestamp, variation group, and any other relevant parameters. Organize your data into clear columns that separate different experimental variations and corresponding performance indicators.
Pay close attention to sample size and statistical significance while preparing your data. Statology emphasizes the importance of running tests with adequate participant volumes to ensure reliable results. Remove any outliers or irrelevant data points that might skew your analysis, and verify that your dataset represents a truly random and representative sample of your target audience.
Before diving into deep analysis, perform a quick data hygiene check. Validate that all collected information is complete, correctly formatted, and free from obvious errors or inconsistencies. This preparatory step might seem mundane, but it dramatically improves the quality and trustworthiness of your eventual insights.
Step 2: Identify Key Performance Indicators and Metrics
Coursera highlights that key performance indicators (KPIs) are critical tools for understanding and tracking experimental success. Your primary objective in this step is to select meaningful metrics that directly reflect the goals of your A/B test and provide actionable insights into user behavior and conversion potential.

According to ProductMe.org, successful A/B testing requires defining specific testable hypotheses and selecting appropriate performance metrics. Start by mapping out the core objectives of your experiment. Are you trying to increase click through rates, improve conversion percentages, reduce bounce rates, or enhance user engagement? Each goal demands specific metrics. For conversion focused tests, track metrics like signup rates, purchase completions, or form submissions. For engagement tests, monitor time on page, interaction rates, or scroll depth.
When selecting metrics, prioritize indicators that are directly connected to your primary business objectives. Avoid vanity metrics that look impressive but do not drive meaningful outcomes. For instance, a high number of page views means little if those views do not translate into conversions. Always choose metrics that provide clear evidence of user behavior changes and potential business impact. Your selected KPIs should be quantifiable, relevant to your specific experiment, and capable of providing unambiguous insights that guide strategic decision making.
Step 3: Analyze Statistical Significance and Reliability
Science News Today emphasizes the critical importance of statistical significance in validating A/B test results. Your goal in this step is to determine whether the differences observed between your test variations are meaningful or simply the result of random chance. Statistical significance helps you confidently distinguish between genuine performance improvements and statistical noise.

Begin by calculating the p value, which measures the probability that your observed results occurred by random chance. A traditional threshold is a p value less than 0.05, indicating a 95% confidence level that the results are not due to random variation. Pay close attention to your sample size larger sample sizes provide more reliable and statistically robust insights. Consider using statistical tools or calculators that can help you quickly compute significance levels and confidence intervals.
When interpreting your results, look beyond raw numbers and focus on practical significance. A statistically significant result does not automatically mean the difference is meaningful for your business. Evaluate the magnitude of the change and its potential impact on key performance indicators. Consider factors like implementation complexity, potential user experience modifications, and actual business value. Sometimes a small statistically significant improvement might not justify the resources required for implementation. Always contextualize your statistical findings within your broader business strategy and user experience goals.
Step 4: Compare Variation Results to Draw Insights
GeeksforGeeks highlights the critical process of systematically comparing A/B test variations to understand user behavior and performance differences. Your primary goal is to move beyond raw numbers and extract meaningful patterns that reveal which version of your experiment truly resonates with your target audience.
Start by creating a comprehensive side-by-side comparison of your test variations. Look for consistent patterns across different metrics rather than focusing on isolated data points. Examine how each variation performed across key performance indicators like conversion rates, engagement times, and user interactions. Pay special attention to statistically significant differences that demonstrate a clear advantage for one variation over another.
The Interaction Design Foundation emphasizes the importance of ethical interpretation and user consent when drawing insights from A/B testing results. While comparing results, consider the broader context of user experience. A variation that shows marginal statistical improvement might not always represent the best overall solution. Evaluate the qualitative aspects of each variation context, user feedback, and potential long term impacts. The most successful A/B test insights go beyond simple numerical comparisons and provide a holistic understanding of user preferences and behavioral trends.
Step 5: Validate Outcomes and Implement Winning Changes
Coursera emphasizes the critical process of validating A/B test outcomes to improve user engagement and conversion strategies. Your primary objective is to transform statistical insights into actionable improvements that drive meaningful business results. This stage is where data transforms from numbers on a screen to strategic decisions that can significantly impact your organization's performance.
Digital Academy recommends trusting analytics over intuition when implementing test results. Begin by creating a comprehensive implementation plan for the winning variation. This involves not just applying the successful test results, but understanding the underlying user behavior that drove those improvements. Carefully document the specific changes that produced positive outcomes and develop a rollout strategy that minimizes potential disruption to your existing user experience.
Be prepared to monitor the implemented changes closely after deployment. Track performance metrics to ensure that the improvements observed during the A/B test translate into real world results. Sometimes variations that perform well in controlled test environments might behave differently at scale. Establish a feedback loop that allows for quick adjustments and continuous optimization. Remember that A/B testing is an iterative process data from one test should inform and inspire future experiments, creating a cycle of continuous improvement and user centered design.
Turn A/B Test Data Into Powerful Growth with Stellar
Interpreting A/B test data correctly can feel overwhelming when faced with messy datasets, unclear metrics, and uncertain statistical significance. This article highlights the challenge of organizing your results, picking the right KPIs, and validating insights to make confident decisions that fuel business success. If you are a marketer or growth hacker seeking to overcome these common hurdles and drive smarter experimentation, Stellar has your solution.
Experience simplicity and speed with our A/B Testing Tool. Stellar’s lightweight script and no-code visual editor allow you to set up tests effortlessly without technical delays. Track critical goals accurately with advanced goal tracking, so you never miss meaningful data points. Access real-time analytics to spot trends immediately and validate outcomes with confidence. This tool was built specifically for small to medium-sized businesses eager to act on data instead of guessing.

Don’t let complicated setups or ambiguous results hold you back from making data-driven decisions today. Visit https://gostellar.app and start using Stellar to translate your A/B test findings into clear, actionable improvements right now.
Frequently Asked Questions
How can I prepare my A/B test data for analysis?
To prepare your A/B test data, create a detailed spreadsheet that captures all relevant metrics like conversion rates and user actions. Start organizing your data into clear columns for each variation, ensuring it is free from errors or inconsistencies to facilitate reliable analysis.
What key performance indicators (KPIs) should I focus on when analyzing A/B test results?
When analyzing A/B test results, choose KPIs that directly relate to your testing goals, such as conversion rates, click-through rates, or engagement times. Prioritize metrics that translate into actionable insights and align with your business objectives to guide effective decision-making.
How do I determine if my A/B test results are statistically significant?
To determine statistical significance, calculate the p-value from your data, aiming for a threshold of less than 0.05. A statistically significant result indicates a 95% confidence level that the observed changes are not due to chance and can inform your next steps in decision-making.
What steps should I take to compare variation results?
To compare variation results effectively, create a side-by-side comparison chart of your test variations, analyzing performance across key metrics. Look for consistent patterns and statistically significant differences to draw meaningful insights regarding user preferences and behavior.
How can I validate A/B test outcomes before implementing changes?
To validate A/B test outcomes, analyze the data to ensure the changes align with user behavior and show improvement in key metrics. Monitor the implementation closely after applying these changes, tracking performance over a defined period, like the first 30 days, to confirm real-world results.
Recommended
Published: 12/3/2025