
Growth Teams: Calculate A/B Test Sample Size and Run Time
To calculate sample size for A/B testing, you need five inputs: your baseline conversion rate, a business-relevant minimum detectable effect (MDE), your confidence level (alpha), statistical power (1−β), and how many variants you're splitting traffic across. Feed those into the two-proportion power formula, or drop them into an ab test sample size calculator, and you get two numbers: visitors per variant and how many days you'll need to hit that total.
TL;DR:
- Small MDEs significantly extend testing time, requiring roughly four times more traffic for each halving of the lift target.
- Using a daily traffic estimate, a typical 20% lift detection at 95% confidence and 80% power may need around 13 days for 400 visitors daily, with longer when traffic drops or MDE shrinks.
- Running tests before reaching the planned sample size or peeking at data increases false-positive rates and can lead to misleading conclusions.
- Proper baseline data collection, stable traffic, and avoiding seasonal biases are critical to ensure accurate sample size calculations.
- Adjusting confidence or power levels impacts sample size and testing duration; higher thresholds demand more traffic and time to reach reliable results.
Table of Contents
- How Do You Calculate Sample Size for A/B Testing?
- What Formula Do Calculators Actually Use?
- Worked Example: Calculating Sample Size Step by Step
- How Long Should You Run an A/B Test?
- How Do You Choose the Right MDE and Power?
- What Mistakes Wreck A/B Test Sample Size Calculations?
- Who's Behind This Guide and What Tools Back It Up?
- A Practitioner's Note on Speed vs. Rigor
- A Practical Option for Measuring Baselines and Running Tests
- Where to Cross-Check Your Sample Size Numbers
- Sources
- FAQ
How Do You Calculate Sample Size for A/B Testing?
Every ab testing sample size calculation depends on getting these five inputs right before you touch a formula. Get one wrong, and the calculator spits out a number that looks precise but means nothing.
Baseline conversion rate comes from your most recent stable traffic window, ideally 2 to 4 weeks, filtered to only the eligible audience the test will actually run on. Don't average across a promo period or a holiday spike.
Pick the smallest lift that would actually change your decision to ship.
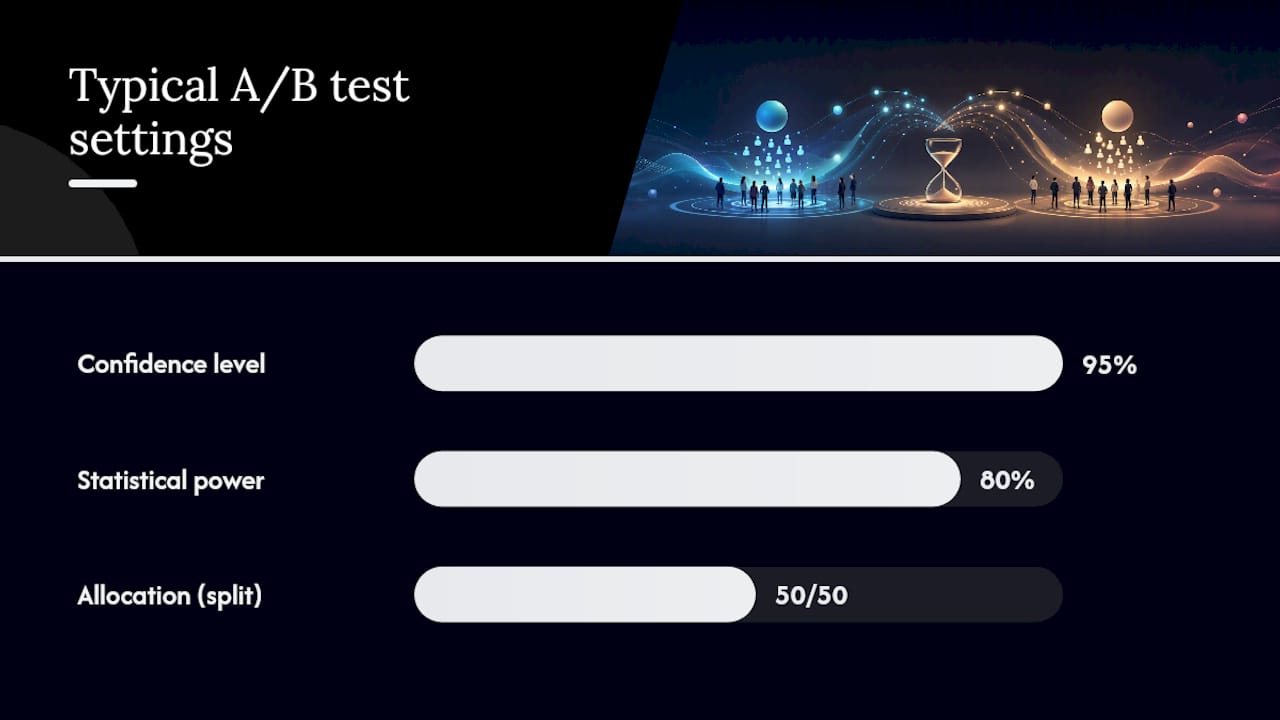
Confidence and power control your error rates. Higher settings need more traffic, so know what you're paying for before defaulting to the highest number available.
- Confidence level (95% is standard): how sure you want to be that a detected effect is real, not noise
- Statistical power (80% is common): your odds of catching a real effect if one exists
- Allocation: a 50/50 split needs the smallest sample size for A/B testing scenario; skew it only for exposure caps or gradual rollouts
- Metric type: binary metrics (converted or didn't) use the proportion formula; continuous metrics (revenue, time on page) need a t-test variant
What Formula Do Calculators Actually Use?
Every ab test calculator on the market, from spreadsheet templates to enterprise dashboards, runs some version of the two-proportion power formula. Here's the plain-English version:
n = 2 × (z_alpha/2 + z_beta)² × p(1−p) / MDE²
The z-values come from your confidence and power choices. Those two numbers rarely change unless you deliberately move your thresholds.
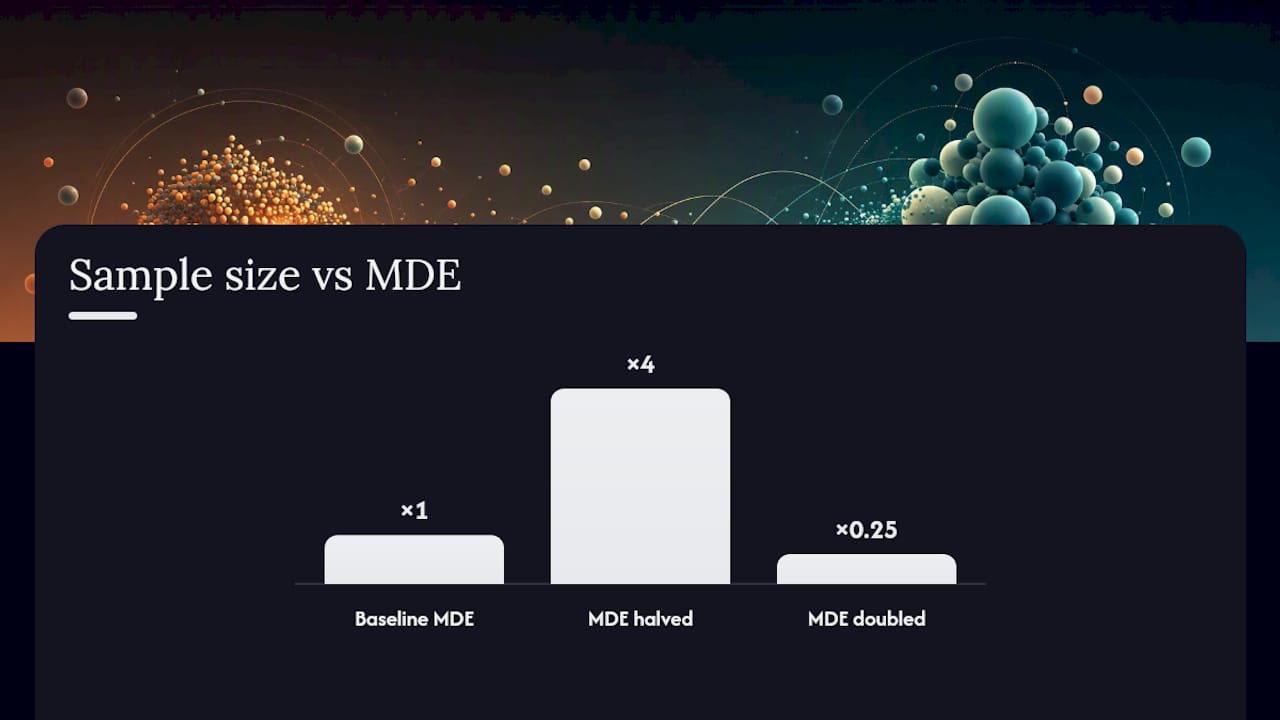
The part worth internalizing: n is proportional to 1 / MDE². Cut your MDE in half and you don't double the required sample. You roughly quadruple it. That single relationship explains why "let's just detect any lift, no matter how small" is the fastest way to design a test that never finishes.
Calculators differ slightly in whether they pool variance across both groups (assuming the two proportions are close) or calculate it separately (unpooled), but for most marketing tests the difference in output is small enough to ignore. If your primary metric is continuous rather than binary, like average order value, the underlying math shifts to a t-test or Welch's t-test, which accounts for unequal variance between groups. Most tests also run two-sided, meaning you're open to the variant winning or losing; a one-sided test needs fewer visitors but locks you out of detecting a negative surprise.
Worked Example: Calculating Sample Size Step by Step
Here's a full ab test sample size calculation using realistic numbers, the kind you'd actually plug into an Evan Miller calculator:
- Baseline: your landing page converts at 5%.
- MDE: you want to detect a 20% relative lift, which means moving from 5% to 6% (a 1 percentage-point absolute gain).
- Confidence and power: 95% confidence, 80% power, the standard combination for most tests.
- Result: roughly 2,545 visitors per variant, or about 5,090 total across a two-variant test.
Say your eligible traffic to that page runs 400 visitors a day, split evenly. That's 200 per variant per day, so 2,545 divided by 200 lands you at about 13 days; round up to about two weeks to capture a complete weekly cycle.
Now watch what happens when you push the inputs. Small dial turns, big traffic bills.
How Long Should You Run an A/B Test?
Duration is total required sample divided by daily eligible traffic, rounded up to full days; operational recommendations advise running tests for at least one full business cycle, often around two weeks for consumer tests.
- Weekday and weekend behavior often differ enough that a 4-day test will hand you a skewed, unreliable read.
- If your business runs monthly billing cycles or has a strong seasonal pattern, extend the run to cover at least one full cycle even if the raw sample math says you could stop sooner.
- Decide your total sample size and stop point before launch, then hold that line even if the results look great, or terrible, on day three.
Checking your dashboard daily and stopping the moment you see a "significant" result is the single most common way marketers fool themselves. Every peek at partial data raises your false-positive rate, sometimes dramatically, because you're implicitly running dozens of hidden tests instead of one. If you need to monitor continuously without inflating error rates, sequential testing methods or a Bayesian framework are built for that; a fixed-horizon test, the kind most calculators assume, is not.
Pro Tip: Write your planned sample size and stop date on the test brief before launch, and treat it like a contract with yourself. If you wouldn't accept "we peeked and it looked good" from a colleague's test, don't accept it from your own.
How Do You Choose the Right MDE and Power?
The MDE question isn't statistical, it's a business question wearing a math costume. Ask yourself: what's the smallest lift that would actually justify shipping this variant, given engineering time and rollout risk? You'll just burn traffic proving something you'd have ignored anyway.
- Default to 95% confidence and 80% power for routine tests. That combination balances traffic cost against error risk reasonably well for most marketing decisions.
- Move to 90% power only for high-stakes changes, like a pricing page redesign or a checkout flow overhaul, where missing a real effect is expensive.
- Consider a one-sided test only when a negative result carries no decision consequence, which is rarer than most people assume.
- Remember the quadrupling rule: every time you halve your MDE to chase more precision, budget for roughly four times the traffic and time.
Choosing an unrealistically small MDE is the most common way well-meaning analysts design tests that technically never finish, or finish so slowly the business has moved on before results land.
What Mistakes Wreck A/B Test Sample Size Calculations?
Even a perfect ab test sample size calculator can't save a poorly designed test. The math is only as good as the assumptions you feed it, and a few recurring mistakes account for most bad calls.
- Stopping early because the dashboard looked good on day 4, before reaching planned sample size.
- Sample ratio mismatch, where your two variants received noticeably unequal traffic, a sign something in your randomization or tracking broke.
- Mis-specified primary metric, testing on a vanity metric while quietly hoping it correlates with revenue.
- Seasonal bias, running a retail test entirely inside a holiday sales window and assuming the lift will hold the rest of the year.
- Data leakage, where users see both variants due to caching, cross-device sessions, or a broken cookie.
Before launch, confirm your primary metric is defined and measurable before you estimate a baseline, lock your MDE, confidence, and power, and write down your planned run length. After the test ends, don't just glance at the p-value. Check the raw visitor and conversion counts per variant, the confidence interval width, and the standardized mean difference between groups to confirm nothing broke silently during the run.
Who's Behind This Guide and What Tools Back It Up?
This guide draws on practical experimentation methodology covered across Gostellar's own library, including deeper looks at interpreting statistical significance in test results, calculating visitors per variation, and running multi-variant experiments when you're testing more than two versions at once.
If you're testing three or more variants, adding a C or D option splits your traffic further and raises your required sample size per arm, since each comparison against control still needs its own statistical power. The platform runs on a lightweight script designed to minimize impact on page speed, which matters because a sluggish page skews the very baseline you're trying to measure. The no-code visual editor, dynamic keyword insertion, and real-time analytics dashboard help capture a clean baseline before using a calculator. A free plan is available for businesses below a certain usage threshold.
A Practitioner's Note on Speed vs. Rigor
Most sample-size mistakes I see aren't math errors, they're impatience dressed up as urgency. Someone picks an MDE that's technically achievable in the traffic they have, rather than the lift that actually matters to the business, then acts surprised when the test drags on or the result gets ignored.
My honest advice: pick your MDE from the decision you need to make, set your sample size once, and don't touch the dashboard until you hit it. Discipline beats cleverness here.
— Juan
A Practical Option for Measuring Baselines and Running Tests
Getting these calculations right depends entirely on clean inputs, and that's where most teams actually lose accuracy, not in the formula, but in messy baseline data pulled from a slow or poorly instrumented test setup.

Gostellar's no-code visual editor lets you launch a test without waiting on developer time, while its advanced goal tracking and real-time analytics dashboard give you the clean conversion data a reliable baseline depends on. Dynamic keyword insertion adds a layer of personalization to landing page variants without extra setup work. Combined with a script light enough not to distort your own page-speed metrics, it's built for teams who need trustworthy numbers going into a calculator, not just after the test ends. If you're planning your next experiment, start with Gostellar and see how it handles baseline measurement on your own traffic.
Where to Cross-Check Your Sample Size Numbers
For a fast gut check, run your numbers through Evan Miller's calculator or Statsig's tool. For methodology and run-rule guidance, read CXL's breakdown and pair your CRO planning with broader conversion tactics.
Sources
- How many subjects do I need for an A/B test? — Evan Miller
- AB Test Calculator: Plan & Analyze Your Experiments Precisely — CXL
- Sample size calculator — Statsig
- Sem
- A/B testing 101 — Nielsen Norman Group
FAQ
What Is a Good Sample Size for A/B Testing?
There's no universal number. A good sample size is whatever your baseline rate, chosen MDE, confidence, and power produce when run through the two-proportion formula, and it can range from a few hundred to tens of thousands of visitors per variant.
What Sample Size Do You Need for A/B Testing With Low-Traffic Sites?
Consider testing on a higher-traffic step in the funnel or widening your MDE to keep the test achievable.
What Sample Size Should You Use for Beta or Pre-Launch Testing?
Beta testing for usability feedback doesn't follow the same statistical rules as a live A/B test since it's exploratory, not confirmatory. Once you move to a live conversion test, apply the standard sample-size formula rather than a fixed beta headcount.
What Sample Size Do You Need for a Bayesian A/B Test?
Bayesian tests don't require a fixed pre-calculated sample size the way frequentist tests do, since they update a probability estimate continuously as data arrives. Most growth teams still run to a reasonable traffic floor, similar to a frequentist estimate, to avoid drawing conclusions from too little data.
Recommended
Published: 9/13/2026