
Typical Ecommerce Conversion Rates: 2026 Benchmarks & CRO Guide
The typical ecommerce conversion rate falls between 1.4% and 3.0% for most U.S. stores in 2026, though the number that actually matters for your store depends entirely on which benchmark you're comparing against. Propel Commerce's cross-source analysis puts the honest spread at roughly 1.4%–3%, with Shopify-specific stores sitting closer to the lower end and enterprise-skewed panels pulling the headline figure up. If you're on Shopify and converting above a moderate threshold, you're already in the top 20% of stores on that platform, with an even higher threshold marking the top 10%.
The single most useful thing you can do with a benchmark is match it to your platform and vertical first, then use it to prioritize where to test. A global average tells you almost nothing on its own.
Key Takeaways
| Point | Details |
|---|---|
| Use platform-matched benchmarks | Shopify stores should compare against Littledata's 1.4% median, not enterprise-panel averages. |
| Top 20% threshold on Shopify | A Shopify store converting at 3.2% or above ranks in the top 20% of the platform. |
| Fix checkout before testing messaging | Checkout friction suppresses all other experiments; sequence structural fixes first. |
| Segment before you diagnose | Mobile, desktop, and traffic-source rates tell different stories; never diagnose from a blended rate. |
| Gostellar for no-code testing | Gostellar's 5.4KB script lets small-to-mid stores run A/B tests without a developer or page-speed penalty. |
Table of Contents
- How do conversion rates differ by industry, device, and traffic source?
- How is ecommerce conversion rate actually calculated?
- What actually counts as a good ecommerce conversion rate?
- High-impact CRO tests you can run this month
- Which tools should you use to measure and improve conversions?
- A short A/B testing playbook for ecommerce stores
- How to benchmark your own store accurately
- Why most stores misread their conversion rate data
- Gostellar makes your first A/B test faster to launch
- Primary sources used in this article
- Sources
How do conversion rates differ by industry, device, and traffic source?
Vertical matters more than almost any other variable. A luxury jewelry store and a food subscription brand can both be "performing well" at wildly different rates.
Industry ranges
Shopify's 12-month industry averages show just how wide the spread gets:
- Food & beverage: ~6.22% (high purchase frequency, low consideration cycle, often subscription-driven)
- Beauty & personal care: ~4.94% (strong brand loyalty, repeat buyers, low AOV reduces friction)
- Arts & crafts: 5.53% per IRP Commerce (impulse-friendly, low price points)
- Home & furniture: 1%–2% range (high AOV, long research cycle, offline comparison shopping)
- Fashion & apparel: 1.5%–3% (size/fit uncertainty drives abandonment)
- Electronics: typically below 2% (high AOV, heavy comparison shopping across retailers)
- Luxury goods: ~0.94% per Shopify (aspirational browsing, high price sensitivity, deliberate purchase cycle)
- Baby & child: 0.51% per IRP Commerce (cautious buyers, safety research, often first-time purchasers)
The pattern is consistent: low-AOV, high-frequency categories convert at multiples of what luxury or high-consideration categories achieve. HubSpot's industry analysis attributes this directly to price point, purchase frequency, and how much offline research a buyer does before committing.
Device breakdown
Statista's device-level data confirms what most merchants already suspect but underestimate in magnitude:
Conversion rates differ by device, with desktop and tablet users typically converting at higher rates than mobile users, who represent the largest share of traffic but convert less frequently. That gap is where most stores leave the most money. Fixing mobile checkout friction, specifically, tends to produce the fastest measurable lift.
Traffic source effects
Traffic source impacts conversion rates significantly, with direct and email traffic generally converting better than paid social, and organic search performing at intermediate levels. Paid search converts well when landing pages match intent tightly; paid social often brings high-volume, low-intent visitors who inflate session counts and suppress your overall rate. Segment your conversion rate by source before drawing any conclusions about store performance.
How is ecommerce conversion rate actually calculated?
The formula is simple. The measurement choices that surround it are not.
Conversion Rate = (Number of Orders ÷ Number of Sessions) × 100 Alternatively: (Number of Orders ÷ Number of Unique Users) × 100 The session-based formula is the most common in published benchmarks. Shopify Analytics and GA4 both default to sessions.
The session-based approach counts every visit, including repeat visits from the same person. A user who visits three times before buying counts as three sessions and one conversion, which mathematically lowers the rate. The user-based approach counts that same buyer once, producing a higher rate. IRP Commerce uses sessions. Littledata uses sessions. If you're comparing your GA4 data to either of those benchmarks, confirm you're pulling the session-based metric, not the user-based one.
Macro vs. micro conversions are the other dimension most stores underuse. A macro conversion is a completed purchase. Micro conversions are the steps before it: product page views, add-to-cart events, checkout initiation, payment entry. Shopify's guidance explicitly recommends tracking both, because a low macro rate with a high add-to-cart rate points to checkout friction, while a low add-to-cart rate points to a product page or traffic quality problem. Those are different problems with different fixes.
Pro Tip: Before comparing your rate to any benchmark, check whether that source uses sessions or users as the denominator. A mismatch of even 0.3–0.5 percentage points can make a healthy store look underperforming or vice versa.
What actually counts as a good ecommerce conversion rate?
"Good" is relative to your platform, vertical, and traffic mix. Here's how percentile bands translate into practical diagnostics.
| Band | Shopify Rate | Cross-Platform Rate | What It Signals |
|---|---|---|---|
| Bottom 50% (below median) | Below 1.4% | Below 1.4% | Traffic-funnel mismatch or significant checkout friction |
| Median / typical range | 1.4%–3.2% | 1.4%–3.0% | Functioning store; CRO gains available |
| Top 20% | ≥3.2% | ≥3.0% | Strong fundamentals; focus on AOV and retention |
| Top 10% | ≥4.7% | ≥6.2% | Sustained CRO investment and personalization are evident |
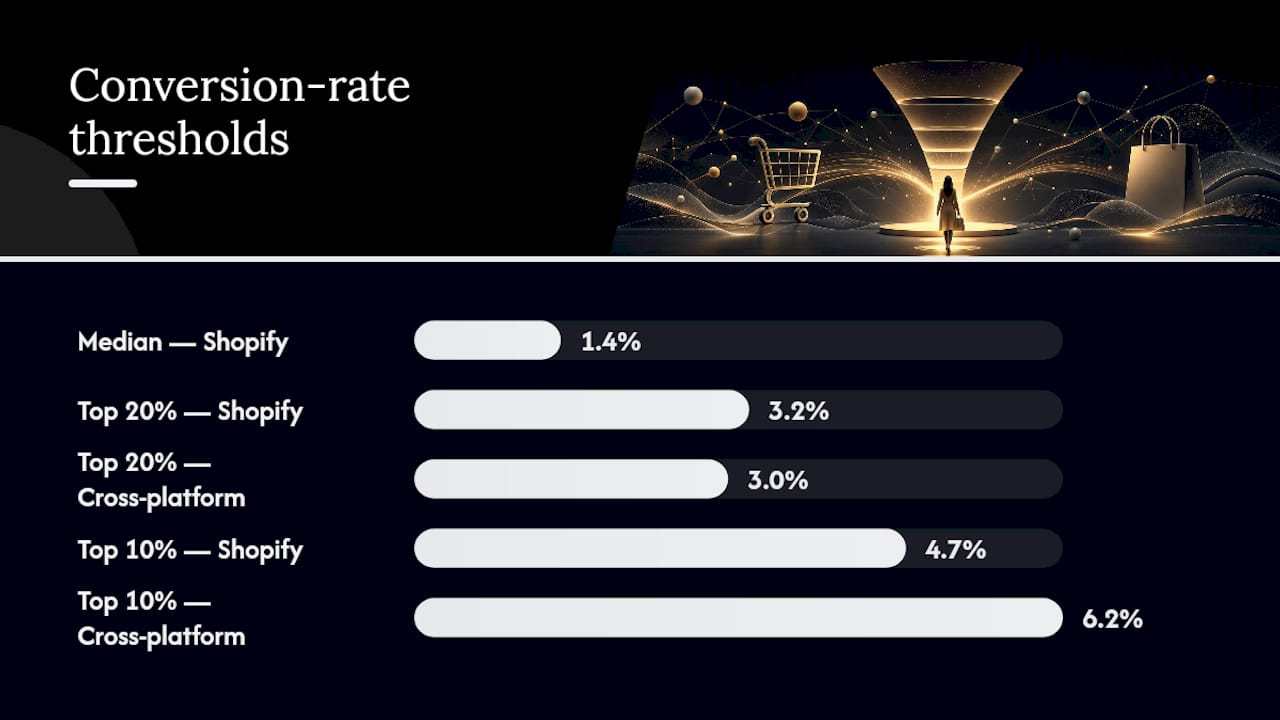
A rate below 1.4% on Shopify almost always signals one of two things: you're sending low-intent traffic (paid social to a generic homepage, for example), or there's a structural checkout problem (unexpected fees, too many form fields, no guest checkout). Those are diagnosable with GA4 funnel reports and a session recording tool like Hotjar or Lucky Orange.
A rate between 1.4% and 3.2% means your store works. The question is where you're losing buyers in the funnel, not whether the store is broken.
- If your rate is low and your add-to-cart rate is normal, the problem is checkout.
- If your add-to-cart rate is also low, the problem is earlier: product pages, pricing, or traffic quality.
- If your rate varies wildly by device, mobile checkout is the priority.
High-impact CRO tests you can run this month
Run them in this order: fix checkout friction before touching hero messaging. Structural problems in the funnel absorb any gains you'd get from better copy.
-
Remove surprise fees at checkout. Hypothesis: showing shipping cost and taxes on the product page reduces checkout abandonment. Metric: checkout completion rate. Run for 2–3 weeks or until you hit 500+ checkout initiations per variant.
-
Add a free-shipping threshold. Hypothesis: a visible "You're $X away from free shipping" bar increases AOV and conversion simultaneously. Metric: conversion rate and average order value. This is one of the highest-ROI tests in ecommerce.
-
Enable accelerated mobile payments. Shop Pay, Apple Pay, and Google Pay reduce mobile checkout to 1–2 taps. Hypothesis: adding these options increases mobile conversion rate. Metric: mobile conversion rate by payment method.
-
Compress page load time on product pages. Run PageSpeed Insights on your top 5 product pages. A 1-second improvement in load time can lift mobile conversions measurably. Hypothesis: reducing LCP below 2.5 seconds increases add-to-cart rate. Metric: add-to-cart rate on treated pages.
-
Add trust signals near the buy button. Return policy, security badges, and review counts placed within 200px of the CTA reduce purchase hesitation. Hypothesis: adding a "Free returns within 30 days" line near the add-to-cart button increases conversion on high-AOV products. Metric: conversion rate on targeted product pages.
-
Test a single-page vs. multi-step checkout. Some stores see lifts from collapsing checkout steps; others see the opposite. Run it as a proper A/B test rather than assuming.
Pro Tip: Fix one checkout friction point before running any messaging or design tests. Checkout problems suppress conversion across every other experiment you run, making it impossible to read results cleanly. Sequence matters as much as the tests themselves. For a structured approach to ecommerce A/B testing, start with the highest-friction step in your funnel.
Which tools should you use to measure and improve conversions?
| Tool | Best For | Key Metric |
|---|---|---|
| GA4 | Funnel analysis, traffic segmentation, goal tracking | Conversion rate by source/device/segment |
| Shopify Analytics | Shopify-native macro and micro conversion tracking | Sessions converted, checkout funnel drop-off |
| Hotjar / Lucky Orange | Session recordings, heatmaps, qualitative diagnosis | Click maps, scroll depth, rage clicks |
| PageSpeed Insights | Performance diagnostics, Core Web Vitals | LCP, CLS, FID scores |
| Gostellar | No-code A/B testing, real-time results, lightweight (5.4KB script) | Variant lift, statistical significance |
GA4 is the foundation. Set up a purchase funnel from product view through checkout complete, then segment it by device and traffic source. That single report will tell you more about where to test than any benchmark comparison. Shopify Analytics adds the merchant-specific layer: it tracks sessions converted and checkout funnel steps natively, which means you don't need custom event setup for basic macro conversion tracking.
Hotjar and Lucky Orange serve a different purpose. They show you why users drop off, not just where. Watch session recordings on your checkout page for 30 minutes before running any checkout experiment. You'll see friction you'd never find in a data table.
PageSpeed Insights is non-negotiable for mobile.
For A/B testing specifically, the tool you choose needs a script light enough not to introduce its own performance penalty. A heavyweight testing script can slow your pages enough to suppress conversion in both variants, making every test result unreliable.
A short A/B testing playbook for ecommerce stores
Running tests without a structured process produces noise, not learning. Here's a lightweight workflow that works for stores with moderate traffic.
-
Write a falsifiable hypothesis. "Adding a free-returns badge near the add-to-cart button will increase conversion rate on product pages by reducing purchase hesitation." Vague hypotheses produce uninterpretable results.
-
Establish your baseline conversion rate. Pull 30–60 days of data for the specific page or funnel step you're testing. Don't use your site-wide rate as the baseline for a product-page test.
-
Estimate required sample size. For a 2% baseline rate and a minimum detectable effect of 0.4 percentage points (a 20% relative lift), you need roughly 10,000–15,000 sessions per variant to reach 80% statistical power. At 500 sessions/day per variant, that's 20–30 days. Most small stores need to run tests longer than they expect.
-
Run the test. Keep both variants live simultaneously. Don't stop early because one variant looks better at day 5. Early stopping is the single most common cause of false positives in ecommerce testing.
-
Analyze and act. Check statistical significance at your predetermined end date. If the result is significant, ship the winner. If it's not, document what you learned about the hypothesis and move to the next test. A null result is still a result.
For a deeper walkthrough of ecommerce optimization through A/B testing, including experiment templates and sequencing logic, the Gostellar blog covers the full process.
Pro Tip: Pause any running test during major traffic events: Black Friday, flash sales, and significant paid budget changes. Seasonality and traffic-mix shifts contaminate results in ways that are impossible to correct after the fact. Resume after the event and extend the runtime to compensate for lost days.
How to benchmark your own store accurately
Producing a defensible benchmark takes about 20 minutes in GA4 or Shopify Analytics. Here's the sequence.
Step 1: Lock in your metric definition. Decide whether you're measuring sessions or users, and stick with it. Sessions is the standard for most published benchmarks.
Step 2: Choose your timeframe. Use a rolling 30–90 day window. Shorter windows introduce seasonal noise; longer windows can mask recent improvements. Avoid including major sale events unless you're specifically benchmarking promotional performance.
Step 3: Segment before comparing. Pull conversion rates separately by device (mobile, desktop, tablet), by traffic source (organic, paid search, paid social, email, direct), and by new vs. returning visitors. Your blended rate is almost meaningless for diagnostic purposes.
Step 4: Compute your percentile position. Compare your segmented rates against the platform-matched benchmarks from Littledata (Shopify) or IRP Commerce (cross-platform). Note which segments are above and below benchmark.
The most common benchmarking mistake: comparing a blended rate that includes email and direct traffic (which converts at 4%–6%) against a benchmark built on all-traffic sessions. Your blended rate will look artificially high, and you'll miss real problems in paid and organic channels.
Minimum sample sizes matter. If a segment has fewer than 1,000 sessions in your window, the conversion rate for that segment is statistically unreliable. Aggregate to a longer window or combine similar cohorts before drawing conclusions.
Pro Tip: New vs. returning visitor conversion rates tell you different things. Returning visitors converting at a high rate means your retention and email programs work. New visitors converting at a low rate means your acquisition targeting or landing page experience needs work. Never average them together when diagnosing a problem.

Why most stores misread their conversion rate data
Most ecommerce teams treat their conversion rate as a single number and then wonder why their CRO efforts don't move it. The number is a blended average of dozens of different user experiences, traffic sources, and device contexts. Optimizing "the conversion rate" without segmenting first is like trying to improve your average restaurant rating by redecorating the bathroom.
The practitioners who consistently move their rates are the ones who treat benchmarks as diagnostic tools, not report card grades. They use the benchmark to identify which segment is underperforming relative to peers, then they run experiments specifically on that segment. The problem isn't the store. It's mobile checkout, and the fix is specific.
There's also a sequencing problem that most teams get wrong. They invest in personalization and advanced segmentation before fixing basic checkout friction. Fixing a broken mobile checkout can double mobile conversion. Do the structural work first.
The other thing worth saying plainly: A/B testing trends for ecommerce have shifted toward faster iteration cycles and smaller, more targeted experiments. The stores gaining ground in 2026 aren't running one big redesign test per quarter. They're running 3–5 focused tests per month on specific funnel steps, learning fast, and compounding those gains.
Gostellar makes your first A/B test faster to launch
Running your first checkout or product-page test shouldn't require a developer sprint. Gostellar's 5.4KB script adds no measurable load penalty to your pages, which means your test results reflect real user behavior rather than a performance artifact from the testing tool itself. The no-code visual editor lets you set up a variant in minutes, and real-time analytics show you exactly when a test has reached significance.

Gostellar's free plan covers stores with up to 25,000 monthly tracked users, which fits most small-to-mid merchants who are just starting to build a testing program. Start your first test free and run the checkout friction experiment from the CRO checklist above within the week.
Primary sources used in this article
- Propel Commerce, 2026 average ecommerce conversion rate analysis: cross-source synthesis explaining the 1.4%–3.0% spread and sample-frame effects.
- Shopify, ecommerce conversion rate guide (2026): 12-month industry averages by vertical and guidance on macro vs. micro conversion tracking.
- IRP Commerce, June 2026 ecommerce benchmarks: session-based cross-industry rate of 2.03% with detailed vertical breakdown.
- Littledata: Shopify-panel benchmarks covering ~2,800 stores; source for the 1.4% median, 3.2% top-20%, and 4.7% top-10% thresholds.
- Statista, global conversion rate by industry and device: device- and vertical-level breakdowns used for the mobile vs. desktop comparison.
- CROgrader, 2026 ecommerce conversion rate benchmarks: global average (~2.8%), regional splits (North America ~3.0%), and top-10% threshold (~6.2%).
Always check the sample frame of any benchmark before comparing. A figure built on enterprise clients tells you nothing useful about a 50,000-session-per-month Shopify store.
Sources
The spread in published figures isn't noise. It reflects genuinely different samples, and knowing which sample resembles your store is the whole game.
- Average ecommerce conversion rate, 2026: the actual numbers by industry | Propel Commerce
- Ecommerce Market Data and Ecommerce Benchmarks for June 2026
- Littledata
- Global conversion rate by industry and device | Statista
IRP Commerce's June 2026 data recorded a session-based rate of 2.03%, up from 1.85% a year earlier. That year-over-year improvement signals the market's progress at converting visitors. CROgrader's 2026 analysis finds regional ecommerce conversion rates vary moderately, offering U.S. merchants a somewhat more favorable baseline than the broader global average.
Enterprise-focused panels like Dynamic Yield and Contentsquare skew higher because their client base includes large retailers with dedicated CRO teams, personalization engines, and years of optimization behind them. Comparing your Shopify store to those numbers is like benchmarking your 5K time against a semi-professional runner.
Pro Tip: Match your benchmark to your platform first. If you're on Shopify, Littledata's panel of ~2,800 Shopify stores is the most directly comparable. If you're on a custom stack or enterprise platform, IRP Commerce or CROgrader's cross-platform figures are a better fit.
Recommended
Published: 8/11/2026