
Website Performance Metrics: A Guide for Marketers
TL;DR:
- Website performance metrics measure how quickly and reliably a site delivers content and influence visitor retention and conversions. Core Web Vitals—LCP, INP, and CLS—are essential for assessing real-user experience and impact search rankings, requiring at least 75% of users to meet "Good" thresholds. Marketers should validate improvements with real user data and prioritize fixing visual stability, responsiveness, and loading speed to enhance both SEO and revenue outcomes.
Website performance metrics are quantifiable indicators that measure how quickly, smoothly, and reliably a site delivers content to users. For digital marketers and business owners, these numbers are not abstract technical scores. They directly predict whether visitors stay, convert, or leave. Google's Core Web Vitals set the industry standard for measuring loading speed, interactivity, and visual stability. Combining those technical signals with user experience metrics gives you a complete picture of how your site performs under real conditions. This guide covers every metric that matters, explains how to read the data correctly, and shows you where to focus your effort first.
What are the Core Web Vitals and why are they critical?
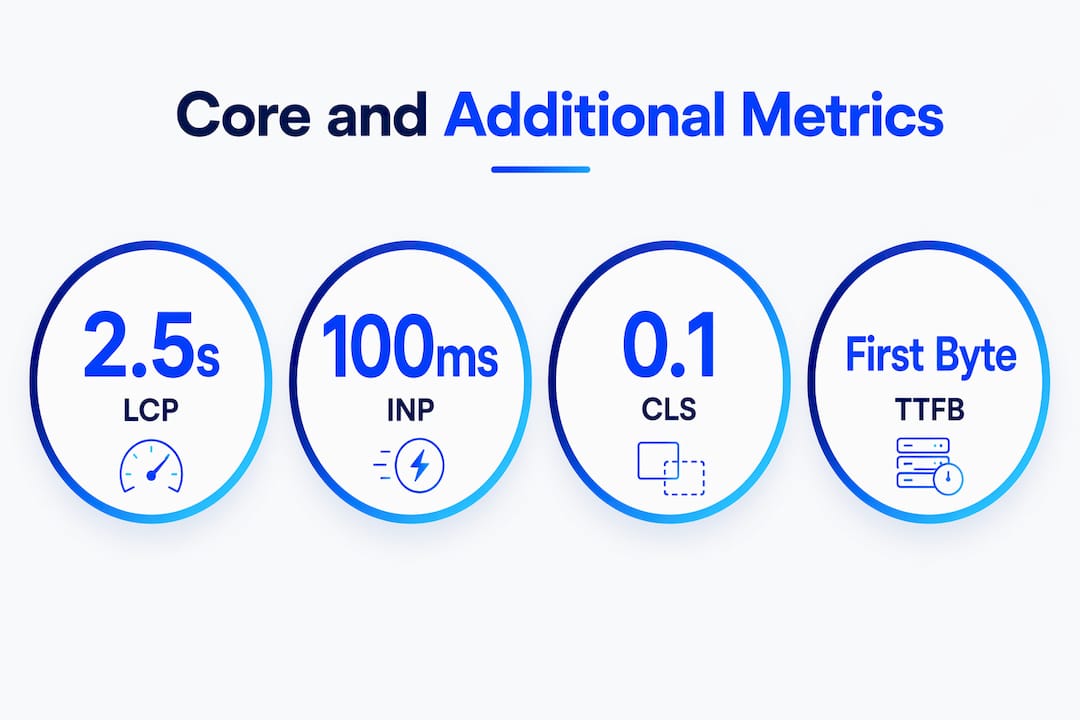
Core Web Vitals are three real-user performance metrics defined by Google: Largest Contentful Paint (LCP), Interaction to Next Paint (INP), and Cumulative Layout Shift (CLS). Each one targets a distinct dimension of the user experience.
- LCP (Largest Contentful Paint) measures loading speed. It marks when the largest visible element, typically a hero image or headline, finishes rendering. Google's "Good" threshold is under 2.5 seconds.
- INP (Interaction to Next Paint) measures responsiveness. It captures how fast the page reacts after a user clicks, taps, or types. The "Good" threshold is under 200 milliseconds.
- CLS (Cumulative Layout Shift) measures visual stability. It scores how much page content unexpectedly shifts during load. A score below 0.1 is "Good." Ads and late-loading fonts are the most common culprits.
Google evaluates these metrics at the 75th percentile of real-user page loads. That means at least 75% of your visitors must hit the "Good" threshold for a page to pass. A single fast load from a fiber connection does not move the needle if most of your audience is on mobile with slower networks.
Core Web Vitals directly influence search rankings. A page that fails any one of the three metrics faces a disadvantage in Google Search, regardless of how strong its content is. Practitioners should investigate all three together. Fixing LCP while ignoring a poor INP score still leaves a ranking and experience gap.

Pro Tip: Use Google Search Console's Core Web Vitals report to see which specific URLs fail at the 75th percentile. Fix the pages with the most organic traffic first for the fastest SEO return.
How do lab-based metrics differ from field data?
Lab data and field data answer different questions. Lab data comes from controlled tests run by tools like Google Lighthouse. Field data comes from real users captured through the Chrome User Experience Report (CrUX). Both are necessary, and neither alone is sufficient.
Lighthouse tests run on simulated mobile devices with throttled CPU and network speeds set to fixed, slower-than-average conditions. This controlled environment makes results reproducible but often slower than what typical users actually experience. A Lighthouse LCP of 4 seconds does not mean every visitor waits 4 seconds.
Field data captures the full range of real conditions: fast phones on Wi-Fi, old Android devices on 3G, users in different countries, and repeat visitors with cached assets. Lab data cannot replicate that variety. The gap between your Lighthouse score and your CrUX data is not a bug. It is a signal that your audience's real conditions differ from the test environment.
The practical implication is significant. Improving a Lighthouse score does not guarantee a field data improvement. You must validate every optimization through CrUX data in Google Search Console to confirm that real users actually benefit. Teams that skip this step often celebrate lab wins that never show up in rankings or conversions.
The best workflow combines both sources:
- Use Lighthouse to diagnose specific technical problems and test fixes quickly in a controlled setting.
- Use CrUX or real user monitoring (RUM) tools to confirm that changes improve actual visitor experiences.
- Segment field data by device type and geography to find where the biggest gaps exist.
What additional metrics should marketers track?
Core Web Vitals are the foundation, but a complete site performance analysis requires additional key performance indicators. The table below covers the most important ones and what each tells you.
| Metric | What it measures | Why it matters |
|---|---|---|
| First Contentful Paint (FCP) | When the first content appears on screen | Signals perceived loading progress to the user |
| Time to Interactive (TTI) | When the page is fully and reliably interactive | Shows when users can actually use the page |
| Total Blocking Time (TBT) | Time the main thread is blocked during load | Predicts INP issues before they appear in field data |
| Speed Index | How quickly content visually fills the viewport | Reflects the overall visual loading experience |
| Page weight | Total transfer size of all resources | Heavier pages load slower on all connections |
FCP and TTI are complementary. FCP tells you when something appears; TTI tells you when users can interact without frustration. A page can have a fast FCP but a slow TTI if heavy JavaScript blocks the main thread after the first paint.
Page weight and request count have a direct relationship with load time. Reducing image sizes, deferring non-critical scripts, and consolidating CSS files all cut page weight and improve FCP and LCP together. Resource optimization is one of the highest-leverage actions available to most marketing teams.
Beyond technical metrics, behavioral signals complete the picture:
- Bounce rate shows the percentage of visitors who leave without interacting. A high bounce rate on a fast page often points to a content mismatch, not a speed problem.
- Average session duration reflects how long visitors engage. Longer sessions typically correlate with better page speed and clearer content structure.
- Conversion rate by page speed segment is the most direct link between performance and revenue. Segment your analytics by load time buckets to see the revenue impact of each second saved.
Pairing speed metrics with behavioral data reveals where users drop off or encounter friction, connecting technical scores directly to conversion funnel performance. For a deeper look at which metrics actually predict revenue, the guide on digital marketing KPIs is worth reading alongside this one.
How to interpret performance data and prioritize fixes
Reading performance data correctly is more valuable than collecting it. The Lighthouse performance score weights its component metrics unevenly: Total Blocking Time carries roughly 30% of the score, while LCP and CLS each carry about 25%. That weighting tells you where to focus if your goal is to move the overall score.
- Start with CLS. Visual instability is the most disruptive experience for users. A layout shift that moves a button just before a user taps it causes misclicks and frustration. Fix CLS before chasing marginal LCP improvements.
- Address TBT to improve INP. High TBT in lab data predicts poor INP in the field. Audit your JavaScript for long tasks and third-party scripts that block the main thread.
- Segment before you act. Break your field data by device type, geography, and new versus returning users. A slow LCP on mobile in Southeast Asia may point to a CDN gap, not a code problem.
- Validate in the field. After deploying a fix, wait for CrUX data to update, typically within 28 days, before declaring success. Lab improvements that do not appear in field data mean the real bottleneck is elsewhere.
- Connect metrics to conversions. Map your Core Web Vitals scores against conversion rate by page. Pages with poor INP scores often show higher cart abandonment. That connection makes the business case for developer time.
Pro Tip: Run A/B tests on performance changes using a lightweight testing tool. Gostellar's 5.4KB script adds virtually no load overhead, so you can test speed improvements without skewing the very metrics you are trying to fix. Learn more about Core Web Vitals A/B testing without the performance cost.
Separating behavioral and attitudinal UX metrics reveals how speed and satisfaction together explain conversion rate variations. A page that loads fast but confuses users still converts poorly. Technical scores and experience signals must be read together, not in isolation.
Key Takeaways
Tracking website performance metrics only creates value when you act on both technical scores and real-user behavioral data together.
| Point | Details |
|---|---|
| Core Web Vitals are the baseline | LCP, INP, and CLS each have defined thresholds; all three must pass for full SEO benefit. |
| Field data beats lab data for decisions | Validate every fix through CrUX or Search Console, not just Lighthouse scores. |
| TBT drives the Lighthouse score | At roughly 30% weight, reducing main-thread blocking time moves the overall score fastest. |
| Segment data before prioritizing | Device type and geography segments reveal the real bottleneck behind aggregate numbers. |
| Connect speed to conversions | Map performance scores against conversion rate by page to build the business case for fixes. |
Why I think most marketers are reading their performance data wrong
Most marketers I work with treat their Lighthouse score like a report card. They run a test, see a number, and either celebrate or panic. That is the wrong frame entirely.
Lighthouse is a diagnostic tool, not a performance grade. A score of 90 on a simulated mobile device tells you nothing about what your actual visitors experience on their real devices in their real locations. I have seen pages with Lighthouse scores in the 80s that convert at twice the rate of "perfect" 100-score pages, because the fast pages were optimized for the test environment, not for the audience.
The shift that changes everything is moving from lab-only monitoring to real user monitoring. When you watch actual session data, you start seeing patterns that no synthetic test reveals. A specific device model that consistently triggers layout shifts. A geography where your CDN has a gap. A JavaScript bundle that blocks interaction only on mid-range Android phones.
The other mistake I see constantly is treating performance work as a one-time project. Speed degrades. Every new marketing tag, every third-party widget, every uncompressed image added to a landing page chips away at the gains you made last quarter. The teams that maintain fast sites treat performance metrics the same way they treat conversion rate: something to review weekly, not annually.
My honest advice is to pick three metrics, LCP, INP, and your conversion rate by load time segment, and review them every week. That discipline alone puts you ahead of most competitors.
— Juan
How Gostellar helps you act on performance data
Understanding your metrics is only half the work. Acting on them without slowing your site down is where most teams get stuck.

Gostellar is built for exactly this problem. Its A/B testing platform runs on a 5.4KB script, which means your experiments add no meaningful load overhead to the pages you are trying to improve. The no-code visual editor lets marketers test layout changes, content variations, and page structure without waiting on developer cycles. Real-time analytics show you whether a change improves engagement and conversion rate as field data comes in. For teams tracking Core Web Vitals alongside conversion goals, Gostellar's advanced goal tracking connects the two data streams in one place. There is a free plan for sites with under 25,000 monthly tracked users, so you can start measuring impact immediately.
FAQ
What are website performance metrics?
Website performance metrics are quantifiable measurements that capture how fast, stable, and interactive a site is for real users. They include technical indicators like LCP and CLS as well as behavioral signals like bounce rate and session duration.
What is a good LCP score?
Google defines a "Good" LCP as under 2.5 seconds. Scores between 2.5 and 4 seconds need improvement, and anything above 4 seconds is considered poor.
Why does my Lighthouse score not match my Search Console data?
Lighthouse runs on a simulated device with throttled network and CPU settings, which often produces slower results than real users experience. Search Console uses CrUX field data from actual Chrome users, making it the more accurate source for ranking evaluations.
How do Core Web Vitals affect SEO?
Google uses Core Web Vitals as a ranking signal evaluated at the 75th percentile of real-user page loads. A page must hit "Good" thresholds across LCP, INP, and CLS to receive the full benefit of the Page Experience signal.
Which performance metric has the biggest impact on conversions?
Page load time and INP have the strongest direct links to conversion rate. Slow interactions and layout shifts both cause users to abandon tasks, making them the highest-priority fixes for marketers focused on revenue outcomes. The relationship between speed and conversions is well documented across industries.
Recommended
Published: 7/14/2026