
Boost website UX with proven A/B testing strategies
TL;DR:
- Most A/B tests are inconclusive due to limited traffic, weak design, or random chance, making only a small percentage statistically significant.
- Marketers often fall prey to the multiple comparisons problem, inflating false positives when testing multiple variants or metrics simultaneously.
- Building a disciplined, program-level UX testing approach with pre-registered hypotheses and proper statistical controls leads to more reliable insights and ongoing conversion improvements.
Running an A/B test and waiting for a winner sounds simple enough. But many A/B tests are inconclusive or show no statistically significant result, meaning the effort produces no clear direction. For marketers and conversion optimization specialists at small to medium-sized businesses, this is not just frustrating — it's expensive. You spend time and traffic on experiments that go nowhere. This guide cuts through the noise by explaining why so many tests fall flat and how a disciplined, program-level approach to website user experience (UX) testing actually moves the needle.
Table of Contents
- Why most A/B tests are inconclusive
- The multiple comparisons problem: What most marketers miss
- Building a reliable website UX testing program
- From test results to real-world website improvements
- Our take: Why chasing every "win" can mislead marketers
- Ready to improve your website UX? Take the next step
- Frequently asked questions
Key Takeaways
| Point | Details |
|---|---|
| Most tests inconclusive | A high share of A/B tests fail to show clear winners, so program-level strategy is essential. |
| Beware multiple comparisons | Testing many variations or metrics at once can inflate false positives unless proper controls are used. |
| Value of rigorous process | Defining goals, preregistering tests, and sticking to primary metrics drive reliable improvements. |
| Iterate and learn | Use every test outcome to inform the next round of UX optimization for better results over time. |
Why most A/B tests are inconclusive
Here's a truth that doesn't get discussed enough: the majority of A/B tests don't produce a clean winner. That's not pessimism; it's data. Conversion rate benchmarks consistently show that a substantial share of experiments end up statistically inconclusive or show no significant lift in either direction.
Understanding why helps you build a better program from the start. The three most common causes are:
- Insufficient traffic volume. When you don't have enough visitors split between your control and variant, the test lacks the statistical power to detect a real difference. You might see a small lift in variant B, but you can't tell if it's real or just noise.
- Weak test design. Testing a change that's too minor (like a different shade of blue on a button) rarely moves conversion rates by a meaningful margin. If your expected effect size is tiny, you need enormous traffic to confirm it.
- Random chance (sampling bias). Short tests run during atypical periods, such as a sale week or a holiday, can pick up behavioral quirks that don't represent normal user behavior.
Here's a realistic breakdown of how A/B test outcomes are typically distributed across a mature testing program:
| Outcome | Approximate frequency | What it means |
|---|---|---|
| Statistically significant win | 10–20% of tests | Variant B outperforms control with confidence |
| Statistically significant loss | 10–15% of tests | Variant B hurts performance |
| Inconclusive / no significance | 65–80% of tests | No reliable difference detected |
"A substantial share of A/B tests are not statistically significant or are inconclusive — this is the norm, not the exception." — Conversion Optimization Statistics 2026
These numbers aren't discouraging. They're a reality check. When you accept that most tests won't produce fireworks, you stop making reckless decisions based on weak data, and you start designing smarter experiments. Understanding how UX and conversion rates interact is the first step to prioritizing which experiments are actually worth running.
The multiple comparisons problem: What most marketers miss
Most marketers know about statistical significance. Far fewer know about the trap that makes their "wins" unreliable: the multiple comparisons problem.
Here's the core issue. Every time you run a statistical test, there's a baseline probability of getting a false positive, meaning you see a winner when there isn't one. With a standard 95% confidence threshold, that false positive rate is 5% per test. Run 20 tests, and you'd expect one of them to show a false positive by chance alone, even if none of the changes actually worked.
The risk compounds when you:
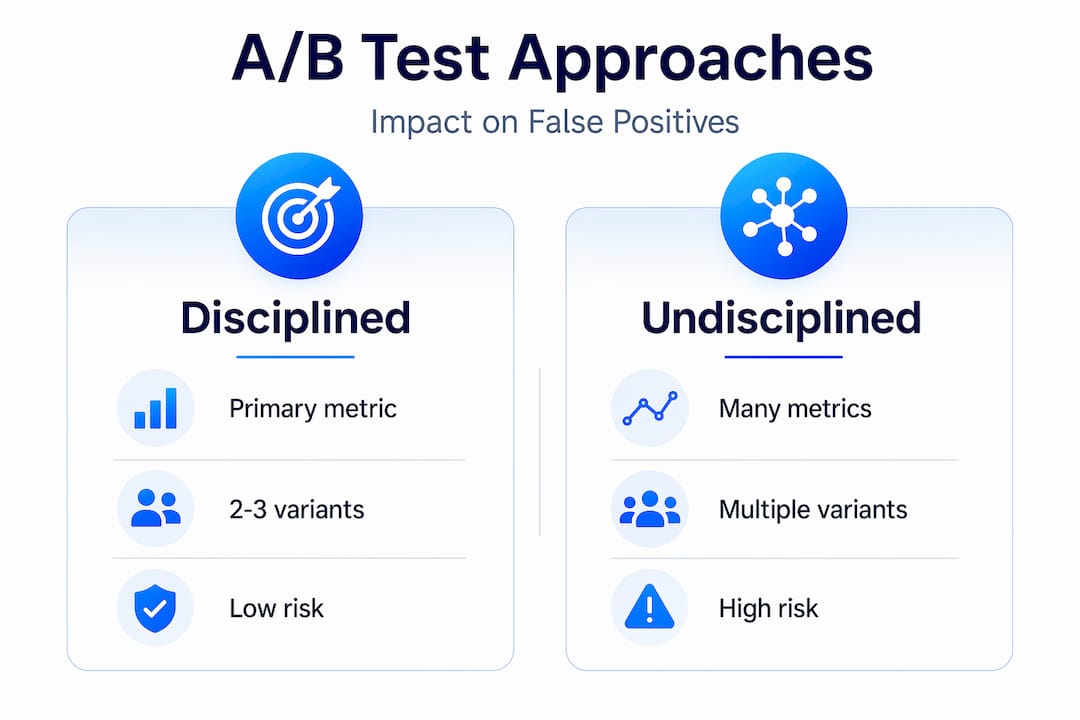
- Test three or more variants simultaneously (A/B/C/D testing without corrections)
- Check results daily before the test reaches its pre-determined sample size
- Track five or six metrics and declare a winner based on whichever one looks best
Multiple comparisons in testing inflate your false positive rate dramatically. Pre-specifying your primary metric before the test launches is not optional; it's the difference between a finding you can act on and a coincidence you can't replicate.
Here's how corrected and uncorrected approaches compare in practice:
| Approach | Primary metric declared upfront? | Multiple metrics tracked? | False positive risk |
|---|---|---|---|
| Uncorrected (common practice) | No | Yes (5+ metrics) | High (can exceed 30%) |
| Basic correction | Yes | 1 primary, others secondary | Moderate |
| Sequential / Bayesian method | Yes | Pre-specified | Low and controlled |
Pro Tip: Before you launch any test, write down one single primary metric you'll use to declare a winner. Everything else is a secondary observation. This one habit eliminates most false positive inflation.
Practical steps to reduce your false discovery rate:
- Pre-register your hypothesis. Write down what you expect to happen, why, and which metric proves it, before you start the test.
- Limit variants to two or three. More variants require exponentially more traffic to reach valid conclusions. Start with A/B before graduating to A/B/C.
- Set your sample size upfront. Use a power calculator to determine how many visitors you need. Don't peek and don't stop early.
- Apply corrections if testing multiple metrics. The Bonferroni correction or false discovery rate (FDR) adjustments account for the inflation that comes with secondary metrics.
- Treat frequent "winners" as a red flag. If you're seeing wins too often, that's a diagnostic signal, not a success signal. It likely means your statistical controls are too loose.
Mastering these principles transforms the way you approach analyzing test results. You'll move from hoping a number turns green to actually understanding what the data says.
Building a reliable website UX testing program
Once you understand what breaks tests, the next challenge is building a system that consistently produces trustworthy results. The shift from running random experiments to running a disciplined testing program is where real user experience optimization gains happen.

Program-level management yields more reliable outcomes than obsessing over individual tests. That's because business impact accumulates across dozens of experiments over months, not from one experiment over two weeks.
Here's what a reliable UX testing program looks like in practice:
- Define clear, business-aligned goals. Each test should trace back to a KPI that matters: bounce rate, checkout completion, form fills, time on page. Vague goals produce vague results.
- Build a prioritized test backlog. Use a scoring framework like ICE (Impact, Confidence, Ease) or PIE (Potential, Importance, Ease) to rank experiments. Don't just test what's easy; test what's high-value.
- Pre-register every test. Write the hypothesis, the primary metric, the expected direction of change, and the minimum sample size before you touch your testing tool.
- Limit variants per test. Two variants for most tests; three maximum when testing something like navigation layouts or pricing page designs.
- Protect your test windows. Avoid running tests during known anomalies: product launches, major holidays, or traffic spikes from paid campaigns. These events create noise that wrecks your data.
- Document everything. Every test result, win, loss, or inconclusive, feeds your institutional knowledge. Six months from now, that record helps you build smarter hypotheses.
Pro Tip: Set up long-term rolling cohorts (groups of users tracked over 30 or 90 days) alongside your standard A/B tests. Cohort tracking reveals whether a "winning" change creates sustained behavior improvement or just a short-term novelty effect.
The statistical callout worth internalizing: companies that maintain ongoing testing pipelines with 5 to 10 concurrent experiments can compound small, 2 to 5% conversion improvements into 20 to 40% annual gains. No single dramatic test produces that; the pipeline does.
You'll also find that a strong program naturally surfaces better hypotheses over time. Each test, even an inconclusive one, teaches you something about how your users think. That knowledge feeds your next round of proven ways to increase conversions at the page and flow level.
From test results to real-world website improvements
Knowing your test results is one thing. Knowing what to do with them is where most teams struggle.
Every test ends in one of three scenarios, and each one has a clear action path:
- Statistically significant win: Implement the variant. Document what worked and why. Form a follow-up hypothesis — for example, if a shorter headline won, test shorter body copy next. Build on the signal.
- Statistically significant loss: This is valuable data. The variant hurt performance. Dig into session recordings or heatmaps to understand the user behavior behind the drop. A loss often reveals a user expectation you didn't know existed.
- Inconclusive result: Don't flip a coin. Archive the test, document the conditions, and consider redesigning the experiment with a larger sample size or a more impactful change. Inconclusive doesn't mean bad; it means you don't have enough information yet.
Program-level results matter more than what any single test shows. A team that learns from 20 inconclusive tests and gradually refines its hypotheses will outperform a team that celebrates one lucky winner and stops.
"The compounding effect of a disciplined testing program — where learnings from every test feed back into better hypotheses — is what separates teams with 5% annual CRO gains from teams with 30% annual gains."
Here's a practical process for extracting value from every test in your pipeline:
- Write a test debrief for every outcome. Include the original hypothesis, the result, what it means for user behavior, and what you'll test next.
- Segment your results. A test that shows no lift overall might show a strong lift for mobile users or new visitors. Segment analysis can surface insights your top-line numbers hide.
- Cross-reference with qualitative data. Pair your test results with heatmaps, scroll maps, or user session recordings. Numbers tell you what happened; qualitative data tells you why.
- Schedule iteration cycles. Every 60 to 90 days, review your test archive and identify patterns. Which page types produce wins most often? Which hypotheses keep failing? Patterns drive smarter bets.
For inspiration on converting test learnings into structured site improvements, a strong landing page optimization guide can help you apply these principles to your highest-traffic pages first. And once you've mapped your improvement cycles, use proven steps for conversions to turn those learnings into concrete page changes.
Our take: Why chasing every "win" can mislead marketers
Here's an uncomfortable observation from watching many small and mid-sized teams run A/B tests over the years: teams that celebrate wins the most loudly often improve the least over time.
It sounds counterintuitive. But here's what actually happens. When a test shows a statistically significant win, there's a natural rush to ship the change, share the result, and move on. The problem is that without tight statistical controls, many of those wins are false positives. They don't hold up at scale, and the lift disappears after full rollout. The team has "won" a test but gained nothing — and worse, they've moved away from a control that was actually performing fine.
Frequent winners with weak methodological controls are a diagnostic sign of inflated false positive rates, not a sign that your team is skilled at optimization. If your win rate is above 40%, that's not something to brag about; it's a red flag that your tests aren't rigorous enough.
The real mindset shift is this: the goal of A/B testing is not to win tests; it's to learn about your users. An inconclusive test that teaches you something about how visitors read your pricing page is more valuable than a false positive that briefly bumps your conversion rate before reverting to baseline.
Disciplined skepticism is a feature, not a bug. When we review testing programs that consistently drive compounding UX gains, the common thread isn't a high win rate. It's a culture of rigorous pre-registration, honest result interpretation, and a long-term view of what "improvement" actually means.
CRO tools that prioritize speed help, but only if you pair them with the discipline to run clean experiments. Fast testing with sloppy statistics is just expensive noise.
Ready to improve your website UX? Take the next step
Reliable A/B testing doesn't require a data science team or an enterprise-level budget. It requires the right tool and the right approach.

The GoStellar A/B testing platform is built specifically for marketers and growth teams at small to medium-sized businesses who want to run statistically sound experiments without the complexity of enterprise tools. With a no-code visual editor, real-time analytics, and a lightweight 5.4KB script that won't slow your site down, you can launch clean, well-structured tests in minutes, not days. If you're ready to put the principles from this guide into practice, start by pairing your new testing discipline with GoStellar's built-in goal tracking and explore the full range of website UX optimization strategies to build a pipeline that compounds over time.
Frequently asked questions
Why do so many A/B tests fail to show clear winners?
Most A/B tests are either statistically inconclusive or result in no significant winner because of insufficient traffic, poor test design, or simple random chance, which is the norm in CRO programs rather than an exception.
What is the multiple comparisons problem in testing?
Running too many tests, checking multiple metrics, or peeking at results before reaching your sample size significantly increases the risk of false positives, which is why multiple comparisons inflate your false discovery rate without proper corrections.
How can I make my website UX tests more reliable?
Pre-specify your primary metric before launching, limit variants to two or three, and calculate your required sample size upfront; treating frequent winners as a warning sign rather than a success signal also helps keep your program honest.
Does an inconclusive test mean my idea was bad?
Not at all. Inconclusive results usually reflect statistical limitations in testing rather than a flawed hypothesis, and they often provide useful qualitative direction for redesigning a more powerful experiment.
Recommended
Published: 5/10/2026