
Split Tester Guide: How Marketers Run Better A/B Tests
A split tester is a randomized experiment that shows two or more versions of something (a page, an ad, an email) to separate audience segments and measures which version moves a target metric. The goal is simple: replace opinion with evidence. Marketers use it to raise conversion rate, revenue, or click-through rate; product teams use it to validate a feature before a full rollout.
The value shows up fast once you stop guessing. A properly randomized test with adequate sample size tells you whether a change actually caused the lift you saw, or whether you'd have seen the same bump by chance. Platforms like Firebase A/B Testing build this logic into product experiments by tracking retention and revenue automatically, while ad-focused calculators like SplitTester do the same job for click-through rate comparisons. Either way, you're checking a claim against real behavior instead of trusting a hunch.
Key Takeaways
A trustworthy split test depends on one pre-defined metric, a properly calculated sample size, and a locked analysis plan you don't abandon the moment results look good.
| Point | Details |
|---|---|
| Define one metric first | Pick a single primary metric before launch; secondary metrics add context but shouldn't drive the decision. |
| Calculate sample size upfront | Use your baseline rate and minimum detectable lift to set duration before you look at any data. |
| Guard against false positives | Set guardrail metrics and avoid peeking daily, since early "wins" often reverse by the test's end. |
| Match the tool to the job | Simple flags work for one-off tweaks; dedicated platforms pay off once you're running concurrent tests. |
| Consider a no-code option | Gostellar offers a lightweight, no-code visual editor with built-in goal tracking for marketing teams without dev bandwidth. |
Table of Contents
- What a split test actually does and how it differs from other methods
- Where split testing pays off fastest
- How to design, run, and analyze a split test
- Best practices that keep results honest, and pitfalls that don't
- Do you need a dedicated split testing tool?
- What growth teams get wrong about experiment cadence
- A faster way to launch your next experiment
- Frequently Asked Questions
- Sources
What a split test actually does and how it differs from other methods
A split test sends incoming visitors down two or more paths at random. One path is the control (your current version), the other is the variant (your proposed change). Because the split is random, any difference in outcomes should trace back to the change itself, not to who happened to show up that day.
You need one clear success metric before you launch. Click-through rate and conversion rate work for most landing page and ad tests. Revenue per visitor or retention rate matter more for pricing pages and app features, which is why Firebase A/B Testing treats those as first-class metrics rather than afterthoughts.
Split testing is one method among several, and picking the wrong one wastes traffic:
- A/B (split) testing: two full versions, one variable changed, cleanest read on cause and effect.
- Multivariate testing: multiple elements changed at once to see how they interact, but it needs far more traffic to reach significance.
- Split-URL testing: two entirely different page designs on separate URLs, useful for structural redesigns rather than small tweaks.
- Feature-flag rollouts: gradual exposure without a formal control group, better for risk management than for measuring impact.
Whatever method you choose, the mechanics matter as much as the metric. Consistent exposure (a visitor sees the same variant every time), correct randomization, and at least one guardrail metric to catch unintended damage, like a spike in bounce rate, keep the result trustworthy.
Where split testing pays off fastest
Not every page or campaign deserves an experiment. Split testing earns its keep where small percentage changes translate into real money or where a wrong guess is costly to unwind. The clearest wins tend to show up in:
- Landing pages, especially headlines, hero images, and call-to-action wording
- Paid ad creative and copy variations
- Email subject lines and send times
- Checkout flows, where a 2% lift can mean thousands in recovered revenue
- Onboarding sequences and activation steps
- Pricing page layout and plan framing
- Feature toggles ahead of a full product rollout
Traffic volume decides feasibility. A page getting a few hundred visitors a month will take a long time to reach a reliable read with standard A/B methods; Bayesian or sequential approaches can sometimes get there faster with less traffic, though they trade off some of the simplicity of a fixed-sample test. When you have more test ideas than time, rank them by impact, confidence, and effort. High-impact, high-confidence, low-effort ideas go first, always.
How to design, run, and analyze a split test
Good tests aren't accidents. They follow a sequence, and skipping a step is usually where teams end up with a result they can't trust.
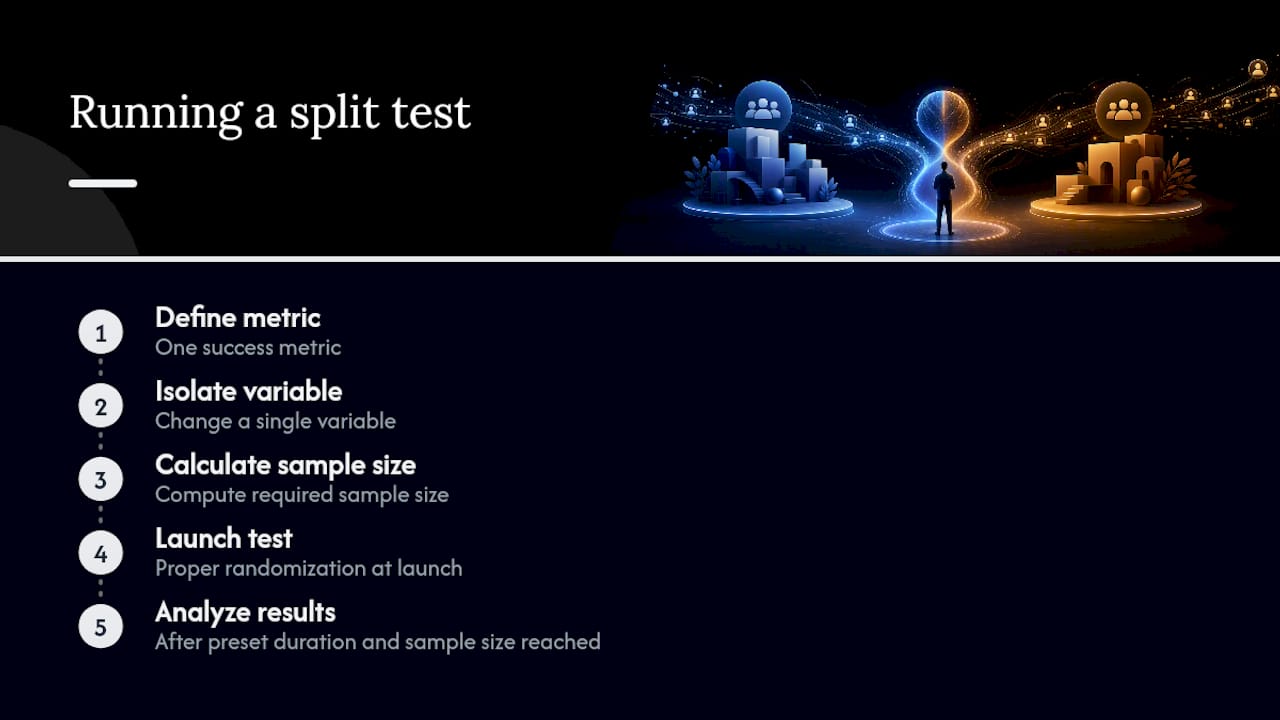
- Define the objective and the single success metric. Pick one primary metric, conversion rate, revenue per visitor, retention, whatever matters most for that page or flow.
- Isolate one variable per variant. Change the headline, or the button color, or the offer. Change three things at once and you won't know which one moved the number.
- Estimate sample size and duration up front. Use your baseline conversion rate, the minimum lift worth detecting, and a standard significance threshold to calculate how many visitors and how many days you need before you look at results.
- Set randomization and allocation. Fifty/fifty splits are standard unless you have a reason (like risk aversion on a high-traffic checkout) to send less traffic to the variant.
- QA everything before launch. Confirm tracking fires correctly on both variants, that visitors stay in the bucket they were assigned to, and that nothing breaks on mobile.
- Lock your analysis plan before you start. Write down your primary metric, your stopping rule, and your significance threshold. Do this before you see a single data point.
- Run the test for the full planned duration. Resist the urge to stop early just because the variant looks like it's winning.
- Analyze against the pre-defined plan. Check the primary metric first, then guardrails, then secondary metrics for context.
- Decide and roll out. Ship the winner, kill the loser, or extend the test if the result is inconclusive.
Before you flip the test live, run through this checklist:
- Tracking pixels or events fire on every variant
- Randomization assigns visitors consistently across sessions
- Segments (new vs. returning, mobile vs. desktop) are tagged for later analysis
- QA links confirm each variant renders correctly
- Guardrail metrics (bounce rate, page load time, unsubscribe rate) are set up to catch damage
For low-traffic pages, that often means running the test for multiple weeks, not days. Ad-specific comparisons can use a simpler check, like the SplitTester calculator, to estimate whether an observed difference in click-through rate is likely to hold up over time. For a more rigorous approach, pair your sample-size math with the statistical concepts that underpin significance testing before you commit traffic to a live experiment.
Pro Tip: Checking results every day and stopping the moment a variant "wins" is the single fastest way to fool yourself. Significance calculated mid-test is not the same as significance calculated at your planned sample size. If you need faster answers on lower traffic, look into sequential testing methods designed for that exact problem, rather than just eyeballing a dashboard early.

Detailed workflows for specific page types, especially checkout and onboarding flows, are covered in this website split testing guide, which walks through measurement templates step by step.
Best practices that keep results honest, and pitfalls that don't
A few habits separate teams that learn something real from teams that chase noise:
- Pre-specify your primary metric before launch, not after you see the data
- Set guardrail metrics so a "win" on conversion doesn't hide a loss elsewhere
- Segment your audience sensibly (device, geography, new vs. returning) without slicing the data so thin that every group becomes underpowered
- Run tests long enough to cover a full weekly cycle, since traffic behavior shifts by day and season
- Lock your analysis plan and stop rules ahead of time
- Track secondary metrics for context, but don't let them override the primary metric
Common pitfalls work the opposite way: peeking at results daily and stopping early, running underpowered tests that can't detect a real effect, running many comparisons without adjusting for the added risk of a false positive, and changing more than one variable so you can't tell which change caused the result. A classic false-positive scenario looks like this: a variant shows a 12% lift in conversion after three days, the team ships it, and a month later revenue per visitor has actually dropped. A revenue guardrail metric, tracked from day one, would have flagged the mismatch before the rollout.
Do you need a dedicated split testing tool?
If you're testing a single headline swap on a low-traffic page, a simple feature flag or manual code split can work fine. Once you're running multiple concurrent tests, need visual editing without a developer, or want built-in significance calculations, a dedicated platform earns its cost quickly.
Tool categories break down into a few types: no-code visual editors built for marketers, full-stack or server-side platforms for engineering-heavy product teams, feature-flag systems with experimentation layered on top, and analytics-integrated suites that combine testing with heatmaps and session feedback. Gartner's peer reviews note that enterprise-grade tools typically add personalization, audience segmentation, and CRM integrations on top of the core testing engine.
When comparing options, weigh these factors:
- Developer effort required to launch a test
- Whether the platform's sample-size and significance calculations are transparent
- QA and preview tools before a variant goes live
- Integrations with your analytics stack and CRM
- Script weight and performance impact on page load
- Reporting depth and segmentation flexibility
- Pricing model, especially how it scales with traffic volume
Pro Tip: Before you commit to a subscription, run one full workflow in the trial: set up a real metric, build a variant with the visual editor, launch it to a small percentage of traffic, and pull a report. If any step feels clumsy in a trial, it'll feel worse under deadline pressure.
For a deeper breakdown of feature sets across categories, this platform selection guide covers what to expect at each pricing tier.
What growth teams get wrong about experiment cadence
Most teams either run too few tests or run the right number with no discipline around prioritization. The fix isn't more tools, it's a tighter loop between quantitative results and qualitative context. A test that lifts conversion by 8% tells you what happened; a quick survey or session replay tells you why, and that "why" is what actually informs the next three tests you run. Feed every finished experiment, win or loss, straight into the product roadmap instead of letting it sit in a slide deck nobody reopens.
A faster way to launch your next experiment
Gostellar gives marketing and growth teams a no-code visual editor built for speed, not engineering tickets. The script weighs 5.4KB, light enough that it won't drag down page load while your test is live, and goal tracking and real-time analytics are built in from the first click.

If your team has been putting off testing because setup felt like a developer request away, this is built for the opposite workflow: pick a metric, build a variant visually, and launch. Dynamic keyword insertion lets you personalize landing pages by traffic source without building separate URLs for every campaign. It fits teams running frequent, low-overhead experiments on landing pages, pricing pages, or checkout flows rather than teams needing a heavy server-side testing stack. Businesses under 25,000 monthly tracked users can start on the free plan and see the full workflow before paying for anything. Head to the Gostellar platform to set up your first test.
Frequently Asked Questions
What is a split tester? A split tester is a tool or method that randomly divides traffic between two or more versions of a page, ad, or email to measure which one performs better against a chosen metric.
How do I run a split test? Define one success metric, isolate a single variable to change, calculate your required sample size, launch with proper randomization, and analyze results only after your pre-set duration and sample size are reached.
How long should a split test run? Long enough to reach your calculated sample size and to cover at least one full weekly cycle, since traffic behavior often shifts between weekdays and weekends.
What's the difference between A/B testing and multivariate testing? A/B testing changes one variable between two versions for a clean read on cause and effect. Multivariate testing changes multiple elements at once but requires significantly more traffic to reach a reliable result.
Do I need statistical significance to trust a test result? Yes. Without checking significance against a pre-planned sample size, an apparent "winner" can easily be random noise rather than a real effect.
Sources
- Best A/B Testing Tools Reviews 2026 | Gartner Peer Insights
- 24 Best A/B Testing Tools to Try in 2026
- Split Tester - Perry Marshall
- A/B testing - Wikipedia
Recommended
Published: 8/20/2026