
What Testing Experiments Reveal About What Actually Works
A testing experiment is a structured procedure where you deliberately change one factor in a system and measure what happens to a specific outcome, while everything else stays fixed. That's it. Whether you're running a chemistry lab session or a headline test on a pricing page, the mechanics are the same: manipulate an input, observe the result, and check whether the difference you see is real or noise.
The distinction that trips people up is between a controlled experiment and an observational study. In a controlled experiment, you assign subjects or users to groups and change one variable on purpose. In an observational study, you just watch what happens naturally and look for patterns. Only the first one lets you claim cause and effect with any confidence, because controlled experiments isolate variables using control and treatment groups.
Here's the bottom line before you design anything: a valid experiment needs three things, and skipping any one of them wastes your time and your traffic; for practical advice, see these conversion rate optimization tips.
- A clear, falsifiable hypothesis stated before you look at results
- A single measurable primary metric, not five competing ones
- Enough sample size and statistical power to actually detect the effect you're looking for
Key Takeaways
A trustworthy testing experiment requires a pre-registered hypothesis, one primary metric with guardrails, adequate sample size for the chosen minimum detectable effect, and analysis that resists peeking.
| Point | Details |
|---|---|
| Definition first | An experiment manipulates a factor and measures its effect on a specific, pre-chosen outcome. |
| Pick the right type | Match lab, field, observational, quasi-experimental, A/B, or multivariate design to the question you're actually asking. |
| Power before you launch | Calculate sample size and minimum detectable effect before collecting data, not after seeing a flat result. |
| Avoid peeking | Use a fixed sample size or a sequential design with always-valid p-values instead of checking and stopping early. |
| Start fast with Gostellar | Gostellar's lightweight script and no-code editor let small teams launch a properly randomized test without engineering delays. |
Table of Contents
- What Is a Testing Experiment and What Types Should You Know?
- What Makes an Experiment Trustworthy?
- How Do You Plan an Experiment That Can Actually Answer Your Question?
- How Do You Analyze Results Without Fooling Yourself?
- How Does Product Experimentation Differ From Lab-Style Testing?
- What Do Real Experiment Examples Actually Look Like?
- What Is the Step-by-Step Process for Running an Experiment?
- How Does a Lightweight A/B Testing Tool Change What's Practical?
- Where Can You Read More on Experiment Design?
- What the Research Actually Supports About Testing Culture
- Run Your Next Test Without the Engineering Bottleneck
- Sources
What Is a Testing Experiment and What Types Should You Know?
A controlled experiment isolates the effect of an independent variable (the thing you change) on a dependent variable (the thing you measure), while holding everything else constant. Khan Academy's breakdown of controlled experiments frames this as changing one factor at a time and comparing a control group against an experimental group, using repetition to rule out chance.
Not every experiment looks the same, and picking the wrong type for your question wastes resources. Here's the practical taxonomy:
- Laboratory experiments happen in a controlled environment where you can pin down nearly every variable. A biology student measuring enzyme activity at different temperatures is running a lab experiment.
- Field experiments move into the real world but keep the manipulation deliberate. Testing a new fertilizer on half of a farmer's plots is a field experiment.
- Observational studies involve no manipulation at all. You watch and record, then look for correlations. Tracking whether smokers develop lung disease at higher rates than non-smokers is observational, because researchers can't ethically assign smoking status.
- Quasi-experimental designs sit in between. You get groups that already exist (a school district, a store location) rather than randomizing subjects yourself, which is common when random assignment isn't feasible.
- Randomized A/B tests split users into two groups by chance, show each group a different version, and measure a business metric like signup rate or revenue per visitor.
- Multivariate tests change several elements at once (headline, image, button color) to measure both individual and combined effects.
A general taxonomy of these categories, including their history and formal definitions, is cataloged in the experiment entry on Wikipedia. For most marketing and product questions, you'll live in the A/B and multivariate world, but the underlying logic borrows directly from the lab.
What Makes an Experiment Trustworthy?
A weak hypothesis produces a weak experiment no matter how much traffic you throw at it. The format that works best is specific and falsifiable: "If we [change X], then [metric Y] will [increase/decrease] by [amount], because [reasoning]." A real example: "If we replace the generic 'Submit' button text with 'Get My Free Quote,' then the click-through rate will increase, because specific action language reduces ambiguity about what happens next."
Trustworthy experiments share four structural features, and each one solves a different failure mode.
- Controls give you a baseline. Without a control group, you can't tell whether an improvement came from your change or from something else entirely, like a seasonal traffic spike.
- Randomization spreads unknown confounding factors evenly across groups, so differences in outcome are attributable to the treatment, not to who happened to land in which bucket.
- Blocking and stratification group similar subjects together before randomizing, which matters when you suspect a factor like device type or traffic source will swing results on its own.
- Replication means running the test long enough, or with enough independent samples, that a one-off fluke doesn't get mistaken for a pattern.
Bias creeps in even when the design looks clean. Confirmation bias shows up when a team keeps checking a "winning" variant and stops the test the moment it looks favorable, ignoring dips that came before. Selection bias shows up when the sample isn't representative of the population you're trying to draw conclusions about, such as testing a feature only on your most engaged users and assuming the result applies to everyone. The fix for both is deciding your stopping rule and your sample composition before the experiment starts, not adjusting either mid-flight based on what you're seeing.
Ethics matters here too, even outside a clinical setting. If your experiment collects personal data, tracks behavior, or changes what users see without their knowledge, you owe them transparency about data use and a legitimate basis for that data collection under your jurisdiction's privacy rules.
Pro Tip: Write your hypothesis and your stopping rule in a shared document before launch, and treat that document as locked. If you want to change the metric or the sample size mid-test, that's a new experiment, not an adjustment to the old one.
How Do You Plan an Experiment That Can Actually Answer Your Question?
Most experiments fail not because the idea was bad, but because the plan around it was sloppy. Planning well means locking down five things before a single user gets exposed to a variant.
- Choose one primary metric. "Conversion rate on the checkout page" is a good metric. "Improve engagement" is not, because nobody can compute engagement without inventing five sub-definitions on the spot. Pair your primary metric with guardrail metrics, secondary numbers you watch to make sure you're not winning on the metric that matters while quietly breaking something else, like average order value or page load time.
- Estimate your minimum detectable effect (MDE). This is the smallest change you actually care about detecting. A test with too few visitors can only reliably catch huge swings, and small, real improvements will hide in the noise. Tools built for experiment design, including open-source frameworks that validate designs against ground-truth simulation, can help you check whether your planned sample size will actually catch the effect size you're hoping for.
- Calculate sample size before launch, not after. The inputs are your baseline conversion rate, your MDE, your desired statistical power (80% is the common convention), and your significance threshold (usually 5%, corresponding to a 95% confidence level).
- Randomize at the right unit. User-level randomization is standard for most web experiments, but session-level or account-level randomization matters when the same person shouldn't see both variants.
- Build assignment integrity checks. Before you trust the results, confirm the groups actually split roughly 50/50 (or whatever ratio you set) and that both groups look similar on variables you didn't manipulate, like device mix or geography.
- Instrument three event types: exposure events (who saw which variant), primary events (did they convert), and guardrail events (did anything else break). Feature flags are the standard mechanism for routing traffic to variants without deploying separate codebases for each version.
Statistical power of 80% is the widely used convention in both academic and applied prep. It means that if a real effect exists at the size you specified, your test has an 80% chance of detecting it. Drop below that threshold and you risk running an experiment that could never have found the answer no matter how the treatment actually performed.
Skipping the sample size calculation is the single most common reason experiments produce "no significant difference" results that actually just mean "we didn't collect enough data to know."
How Do You Analyze Results Without Fooling Yourself?
Statistical analysis is where good experiments go to die, usually from impatience. The frequentist approach, the one most A/B testing tools default to, gives you a p-value and a confidence interval. The p-value tells you how likely you'd see a difference this large (or larger) if there were truly no effect. A confidence interval gives you a range of plausible values for the real effect size, which is often more useful for decision-making than the p-value alone.
Two error types matter in this framework. A Type I error is a false positive: you declare a winner when there's no real effect. A Type II error is a false negative: you miss a real effect because your test was underpowered. Report both the p-value and the confidence interval, not just "significant" or "not significant," so a reader can judge the size of the effect, not just its existence.
The Bayesian alternative reframes the question. Instead of asking "how surprising is this data if nothing changed," it asks "what's the probability the treatment beats control, given everything we've observed?" Bayesian output often reports as a direct probability (say, 87% chance B beats A) alongside an expected loss calculation, the expected downside if you ship the wrong variant. Product teams tend to like this framing because it maps more directly onto a ship/don't-ship decision.
- Never peek at results and stop the moment you like what you see. Checking a test repeatedly and stopping at the first significant-looking result inflates your false-positive rate far above your stated significance threshold.
- If you need to check results early and often, use a sequential testing design with always-valid p-values, built specifically to let you look at data continuously without inflating error rates. Open-source experimentation engines that combine variance-reduction and peeking-safe sequential methods exist specifically to handle this.
- Consider CUPED (Controlled-experiment Using Pre-Experiment Data), a variance-reduction technique that uses data from before the experiment started to shrink the noise in your outcome metric, which lets you detect smaller effects with the same sample size or reach significance faster with the same effect size.
Teams that adopt CUPED and sequential designs together typically get two benefits at once: shorter test durations and fewer false alarms from impatient peeking, which is a large part of why the technique shows up in most modern experimentation platforms rather than staying a research curiosity.
How Does Product Experimentation Differ From Lab-Style Testing?
Product teams don't have the luxury of running a six-week lab study for every idea. Product experimentation is hypothesis-driven and iterative, built around A/B tests, multivariate tests, feature-flagged rollouts, and phased releases rather than one-shot studies. The goal shifts from proving a universal truth to making a fast, defensible decision about what to ship next.
The minimum viable experiment (M.V.E.) is the product-world answer to a lab's controlled trial: the smallest test that can validate or kill a risky assumption before you invest in building the full version. Rapid experiments earn their value specifically when they target the riskiest, least-proven part of an idea early, not when they polish something you were already confident about.
- Ship with feature flags. Route a percentage of users to the new experience without deploying two separate codebases, and roll back instantly if guardrails trip.
- Track program-level health, not just individual test wins. Win rate (the share of experiments that beat control), time to decision, and cumulative impact tell you whether your experimentation program is actually productive, separate from any single test's outcome.
- Pre-register hypotheses in a shared log. Writing down what you expect and why, before you see data, keeps teams honest about which "learnings" were predicted and which were rationalized after the fact.
- Build a central results repository. Losing experiments teach you as much as winning ones, but only if someone can find the write-up six months later instead of re-running the same failed idea.
AI-powered features add a wrinkle classical experiments never had to deal with: the same input can produce a different output every time. A/B testing non-deterministic systems requires many more repetitions than a standard test, plus a combination of mechanical scoring and human review, because a single bad run might just be randomness rather than a real regression. The practical fix is to test the configuration (which prompt, which model version) and measure downstream user behavior, like task completion or follow-up questions, rather than judging one output in isolation.
What Do Real Experiment Examples Actually Look Like?
Concrete templates beat abstract theory when you're staring at a blank experiment brief. Four short sketches, one per experiment type:
- Lab-style controlled experiment: Testing whether a new plant fertilizer increases growth rate. Setup: two groups of identical plants, same light and water, one gets the fertilizer. Measurement: height in centimeters at day 14, compared against the control group's growth.
- Landing page A/B test: Hypothesis: "Adding a customer count badge above the fold will increase signup rate by 8%, because social proof reduces perceived risk." Primary metric: signup conversion rate. A rough sample-size calculation based on current baseline conversion and an 8% MDE tells you how many visitors per variant you need before the test can end. Stop rule: run until the pre-calculated sample size is hit, then analyze once.
- Rapid prototype test: Validating desirability for a new onboarding flow before building it. Qualitative signal: do five out of eight test users complete the flow without asking for help? Early quantitative threshold: does a clickable prototype get a completion rate above a pre-set bar before you invest in real engineering?
- AI configuration test: Comparing two prompt versions for a support chatbot. Hold constant: the underlying model version and the evaluation questions. Measure: downstream behavior like resolution rate and follow-up message count, not a subjective read of any single response.
Reviewing high-impact A/B testing examples from actual campaigns can help you calibrate what a realistic effect size looks like before you commit to an MDE.
What Is the Step-by-Step Process for Running an Experiment?
A runbook keeps a team from reinventing the process every time someone has an idea. Four phases, each with a short checklist.
- Pre-launch: Write the hypothesis, lock the primary metric and guardrails, calculate sample size and MDE, confirm instrumentation is firing correctly, and log the pre-registered plan somewhere the whole team can see it.
- Launch: Verify the randomization split looks correct within the first day, confirm exposure events are logging properly, and set up alerts on guardrail metrics so a broken experience gets caught fast.
- Analyze: Use the statistical method you specified before launch, not whichever one gives you the answer you wanted. Check that the groups are balanced on variables you didn't manipulate, and resist the urge to peek unless you built a sequential design specifically for that.
- Close: Document the decision (ship, iterate, or kill) and the reasoning behind it, then add the write-up to your results repository so the next person doesn't have to start from zero.
Pro Tip: Even a losing test earns its keep if you write down why it lost. A one-paragraph postmortem stops the same failed hypothesis from resurfacing under a different name next quarter.
How Does a Lightweight A/B Testing Tool Change What's Practical?
A script's weight directly affects how honest your test results are. Gostellar runs on a 5.4KB script specifically so a testing tool doesn't introduce the kind of page-load lag that skews the metric you're trying to measure in the first place. Pair that with a no-code visual editor and small teams can launch a real, randomized variant without waiting on engineering time, which is often the actual bottleneck behind slow experimentation programs, not a lack of ideas.
- Fast-loading scripts reduce the risk that your test itself becomes a confound in the results.
- A visual editor shortens the path from hypothesis to live experiment for teams without dedicated developer support.
- Early-stage tests for small to medium-sized businesses generally benefit more from launching sooner with a clear primary metric than from building elaborate custom instrumentation before the first test even runs.
Where Can You Read More on Experiment Design?
Further reading on the concepts covered here: Understanding Science, Khan Academy, and Mixpanel's product experimentation guide.
What the Research Actually Supports About Testing Culture
The gap between academic experiment design and product A/B testing is smaller than most teams assume, and that's the part conventional advice keeps missing. Marketers treat statistics as a checkbox and scientists treat feature flags as beneath them, when both disciplines are solving the same problem: telling a real signal apart from noise with limited data.
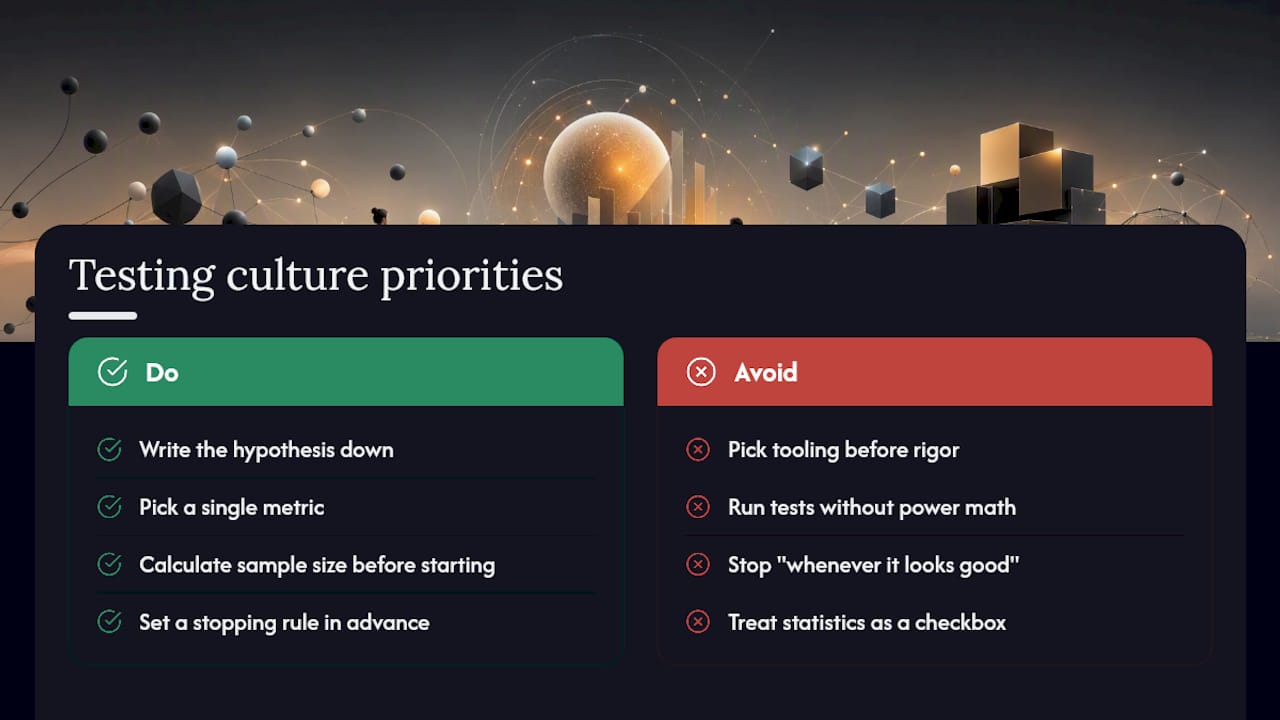
Where the standard advice actually fails people is the obsession with tooling before rigor. Teams spend weeks picking an analytics platform and then run their first test with no sample-size calculation and a stopping rule that's really just "whenever it looks good." That's backward. A spreadsheet and a correct power calculation beats an expensive dashboard bolted onto a sloppy hypothesis every time.
If you take one thing from this guide, prioritize the boring part first: write the hypothesis down, pick one metric, and do the sample-size math before you touch any tool. Velocity matters, but only once you've built the habit of asking a falsifiable question. Skip that step and you're just running expensive coin flips with better UI.
— Juan
Run Your Next Test Without the Engineering Bottleneck
Everything in this guide, the hypothesis discipline, the sample-size math, the guardrail metrics, still needs a way to actually launch. Gostellar is built for the marketer or growth team that wants to move from hypothesis to live variant in an afternoon, not a sprint cycle. The no-code visual editor lets you build and launch a properly randomized experiment without filing an engineering ticket, and the 5.4KB script keeps your page-load times honest so your test results reflect your change, not your tool's overhead.

Dynamic keyword insertion personalizes landing page copy per visitor segment automatically, and real-time goal tracking means you're watching your primary metric and guardrails from day one instead of exporting data into a spreadsheet after the fact. The free plan covers businesses under 25,000 monthly tracked users, which makes it a practical place to run your first properly powered test. If you've got a hypothesis ready, set up your first A/B test on Gostellar and see whether your assumption actually holds up against real traffic.
Sources
Recommended
Published: 8/22/2026