
Web Analytics for Marketers: A Practical 2026 Guide
Web analytics is the measurement, collection, analysis, and reporting of website data to understand and improve site performance and online user behavior. Your immediate next step: confirm you have an active analytics property, a working tracking tag or server-side capture, and at least one conversion event firing correctly.
Before going further, run these three checks:
- Tracking present: Open your browser's network tab and confirm the analytics beacon fires on page load.
- Key KPI defined: Name one primary conversion event your business cares about (form submit, purchase, sign-up).
- Basic QA done: Check the real-time report in your analytics platform and verify at least one live session appears when you visit the site yourself.
Pro Tip: Always test your tracking in a staging environment before pushing to production. A misconfigured tag in production can silently corrupt weeks of data before anyone notices.
Key Takeaways
Web analytics programs that combine a clean 4-step workflow, device-segmented KPIs, and regular QA audits consistently produce more reliable data and faster optimization cycles than those built without structure.
| Point | Details |
|---|---|
| Follow the 4-step workflow | Collect, process, define KPIs, then act — each stage feeds the next and skipping one breaks the chain. |
| Segment by device from day one | Mobile drives a majority of U.S. web traffic; any funnel analysis that ignores device type produces a distorted picture. |
| Prioritize data quality over volume | Bot filtering, deduplication, and quarterly tag audits matter more than tracking every possible event. |
| Match privacy approach to risk | Server-side or cookieless collection reduces compliance exposure for U.S. teams navigating state privacy laws. |
| Gostellar for fast experimentation | Gostellar's 5.4KB script and no-code editor let small teams run A/B tests without developer resources or page-speed penalties. |
Table of Contents
- Why web analytics matters for your marketing and product teams
- What is the 4-step web analytics process?
- How is analytics data collected?
- Which metrics should you actually track?
- What tools do you need for a complete analytics stack?
- How do you set up analytics from scratch?
- Which analysis technique answers which question?
- Privacy, consent, and data governance for analytics
- Common data quality problems and how to fix them
- Real-time experiment analytics: what actually works
- How marketing, product, and UX teams use analytics in practice
- How to connect web analytics with your CRM and marketing platforms
- How to benchmark your analytics data against industry standards
- How to build dashboards that different stakeholders will actually use
- Why regular analytics audits protect your data accuracy
- How to set up goal and conversion tracking tied to business objectives
- The analytics priorities that actually matter for small teams
- Gostellar makes real-time experimentation analytics fast and lightweight
- Sources
Why web analytics matters for your marketing and product teams
Analytics drives measurable improvements across acquisition, conversion, and retention. That's not a vague promise. When you know which traffic sources convert and which pages bleed users, you can fix the right things instead of guessing.
Different teams extract different value:
- Marketing teams use traffic source data and campaign attribution to cut spend on channels that don't convert and double down on those that do.
- Product teams use funnel analysis and event tracking to find where users abandon key flows, then prioritize fixes by revenue impact.
- UX teams use session-level behavior data to identify friction points, test redesigns, and validate improvements before full rollout.
- Analytics teams build the measurement infrastructure that makes all of the above possible.
Mobile devices account for most website traffic in the U.S., which means any funnel analysis that ignores device segmentation is working with a distorted picture. A checkout flow that looks fine on desktop may be hemorrhaging mobile conversions.
The core benefits that follow from a well-run analytics program:
- Higher conversion rates from targeted funnel fixes
- Faster experiment cycles because you're measuring the right events from day one
- Better attribution of marketing spend across channels and touchpoints
- Earlier detection of UX regressions after product releases
What is the 4-step web analytics process?
The web analytics process runs in four stages: data collection, data processing, KPI development, and strategy/action. Each stage feeds the next. Events you collect become processed reports; those reports surface the KPIs you track; those KPIs drive the experiments and optimizations you run.
Here's what each step actually involves:
- Data collection: Capture raw interactions — page views, clicks, form submissions, scroll depth — via tracking tags, server logs, or server-side integrations. This week's action: audit which events are currently firing and list any gaps against your conversion goals.
- Data processing: The platform transforms raw hits into sessions, attributes traffic sources, applies filters, and builds the reports you see. This week's action: check whether bot filtering is enabled and whether internal IP addresses are excluded.
- KPI development: From processed data, define the metrics that map to business objectives — conversion rate, cost per acquisition, retention rate. This week's action: write down three KPIs with a target value and a review cadence.
- Strategy and action: Use KPI trends to prioritize experiments, content changes, or channel investments. This week's action: identify one underperforming funnel step and schedule a hypothesis-driven test.
| Stage | Primary Output | Feeds Into |
|---|---|---|
| Data collection | Raw event stream | Processing pipeline |
| Data processing | Filtered sessions and reports | KPI dashboards |
| KPI development | Tracked metrics with targets | Experiment backlog |
| Strategy and action | Prioritized tests and changes | Next collection cycle |
How is analytics data collected?
The main collection methods are server log analysis, client-side page tagging, server-side capture, and hybrid setups. Each trades off accuracy, real-time capability, privacy exposure, and implementation complexity differently.
Server log analysis reads the request logs your web server generates automatically. Every file request is recorded, including crawlers and bots, which makes logs useful for SEO audits and infrastructure monitoring. The downside: logs capture server-level requests, not user interactions like clicks or scroll depth, and they require parsing tools to be useful.
Client-side page tagging is the dominant method. A JavaScript snippet fires in the browser and sends event data to an analytics endpoint. This is how Google Analytics 4 (GA4) works by default. The limitation is real: ad blockers and privacy browsers can suppress the tag, and users who block scripts simply don't appear in your data.
Server-side collection routes data through your own server before forwarding it to analytics platforms. This approach avoids browser-level blocking, gives you control over what data leaves your infrastructure, and aligns well with privacy requirements. Cloudflare Web Analytics uses an edge-based model that avoids cookies and minimizes fingerprinting while still delivering core site metrics.
Hybrid setups combine client-side tagging for rich interaction data with server-side capture for accuracy and compliance. Most mature analytics programs end up here.
| Method | Accuracy | Real-Time | Privacy Risk | Setup Complexity |
|---|---|---|---|---|
| Server logs | Moderate (includes bots) | No | Low | Low |
| Client-side tags | Good (blocker-affected) | Yes | Higher | Low–Medium |
| Server-side | High | Near real-time | Low | Medium–High |
| Hybrid | Highest | Yes | Configurable | High |
Pro Tip: If your site handles sensitive data or serves privacy-conscious audiences, start with server-side or edge collection. The setup cost is higher upfront, but you avoid the compliance headaches that come from cookie-dependent client-side tracking.
Which metrics should you actually track?
Start with users, sessions, conversion rate, traffic source, and engagement rate. Those five give you a working picture of acquisition, behavior, and outcomes without drowning you in vanity metrics.
A few caveats on common metrics:
- Pageviews tell you volume, not value. A page with 50,000 views and a 0.1% conversion rate is underperforming a page with 5,000 views and a 4% rate.
- Bounce rate (in its GA4 form, now "engagement rate") is only meaningful when you define what "engaged" means for your site. A blog post read in full but with no click is not a failure.
- Sessions can be misleading for single-page apps where navigation doesn't trigger new page loads. Use events instead.
| Metric | What It Measures | When to Use It | Target Focus |
|---|---|---|---|
| Users | Unique visitors over a period | Audience size and growth | Trend upward |
| Sessions | Total visits including repeat | Volume and frequency | Trend upward |
| Conversion rate | % of sessions completing a goal | Funnel effectiveness | Benchmark vs. industry |
| Traffic source | Channel driving visits | Attribution and spend decisions | Diversify; reduce single-source risk |
| Engagement rate | Sessions with meaningful interaction | Content and UX quality | Trend upward |
| Average session duration | Time spent per visit | Content depth and relevance | Context-dependent |
SimilarWeb and similar competitive intelligence tools extend this picture by estimating traffic and engagement for competitor domains, which is useful for benchmarking your own numbers against the market.
Setting SMART KPIs means tying each metric to a specific business objective with a numeric target and a review date. "Improve conversion rate" is not a KPI. For a deeper list of marketing KPIs worth tracking, the priority metrics vary by business model but the framing stays the same: metric, current baseline, target, and owner.
What tools do you need for a complete analytics stack?
A functional analytics stack covers five categories: site analytics, tag management, experimentation, session replay and heatmaps, and privacy-first or lightweight analytics. You don't need all five on day one, but knowing what each does helps you build toward a complete picture.
Capabilities to evaluate when choosing a site analytics platform:
- Real-time reporting with event-level granularity
- Custom event and conversion tracking without requiring developer deploys
- Audience segmentation and funnel visualization
- Integration with ad platforms and CRM systems
- Data export and API access for custom reporting
Capabilities to evaluate for tag management:
- Centralized tag deployment without code changes
- Version control and rollback for tag configurations
- Built-in triggers and variables for common event patterns
- Preview and debug mode for QA before publishing
Google Tag Manager (GTM) handles tag deployment for most teams. It sits between your site and your analytics platform, letting you add or modify tracking without touching the codebase. GA4 is the current standard for site analytics, with event-based tracking replacing the session-hit model of Universal Analytics. Adobe Analytics serves enterprise teams that need advanced segmentation, data workspaces, and tight integration with the Adobe Experience Cloud. Optimizely adds server-side and full-stack experimentation on top of your analytics layer, letting you run controlled tests against the same event stream you're already measuring.
Privacy-first platforms like Ahrefs Web Analytics offer free tiers for smaller sites and cookie-free collection models, which reduces regulatory friction for teams that don't need the full GA4 feature set.
Pro Tip: Don't run more than one full analytics tag on the same page without a clear reason. Duplicate tracking inflates session counts and creates reconciliation headaches. Use a tag manager to control what fires and when.
For orchestrating multiple tools: the standard pattern is GTM managing all tags, GA4 as the primary analytics property, an experimentation platform (like Optimizely) reading from the same data layer, and a CDP or CRM integration for cross-channel identity resolution.
How do you set up analytics from scratch?
The essential path from zero to working measurement: create a property, define your KPIs, install the tag, configure events, and verify data before you trust it.
Step-by-step implementation checklist:
- Create an account and property in your chosen platform. For GA4, follow Google's property setup guide to configure data streams for web and app.
- Define your business KPIs before touching any tag. Write them down. This prevents you from tracking everything and analyzing nothing.
- Install the tracking tag via Google Tag Manager or a direct script embed. GTM is strongly preferred for any site that will evolve over time.
- Configure Google Tag Manager: create a GA4 Configuration tag, set your Measurement ID, and publish.
- Add core events: at minimum, track page views, scroll depth (75%), outbound clicks, form submissions, and your primary conversion action.
- Test in staging: use GTM's Preview mode and GA4's DebugView to confirm events fire correctly before going live.
- Verify real-time data: visit your site and confirm your session appears in the real-time report within 30 seconds.
- Set baseline reports: create a simple dashboard showing daily users, sessions, conversion rate, and top traffic sources. This becomes your weekly reference.
QA checks to run before launch:
- Confirm no duplicate GA4 tags are firing (check network tab for multiple
/collectrequests). - Verify UTM parameters pass through to campaign reports correctly.
- Test conversion events by completing the action yourself and checking DebugView.
- Exclude internal IP addresses from data collection.
Pro Tip: Use a data layer object to pass structured event data from your site to GTM. This decouples your analytics logic from your site code, so future tracking changes don't require developer involvement.
Which analysis technique answers which question?
The technique you reach for depends on the question. Segmentation answers "who," funnels answer "where do they drop off," cohorts answer "how does behavior change over time," attribution answers "what drove the conversion," and path analysis answers "what did they do before converting."
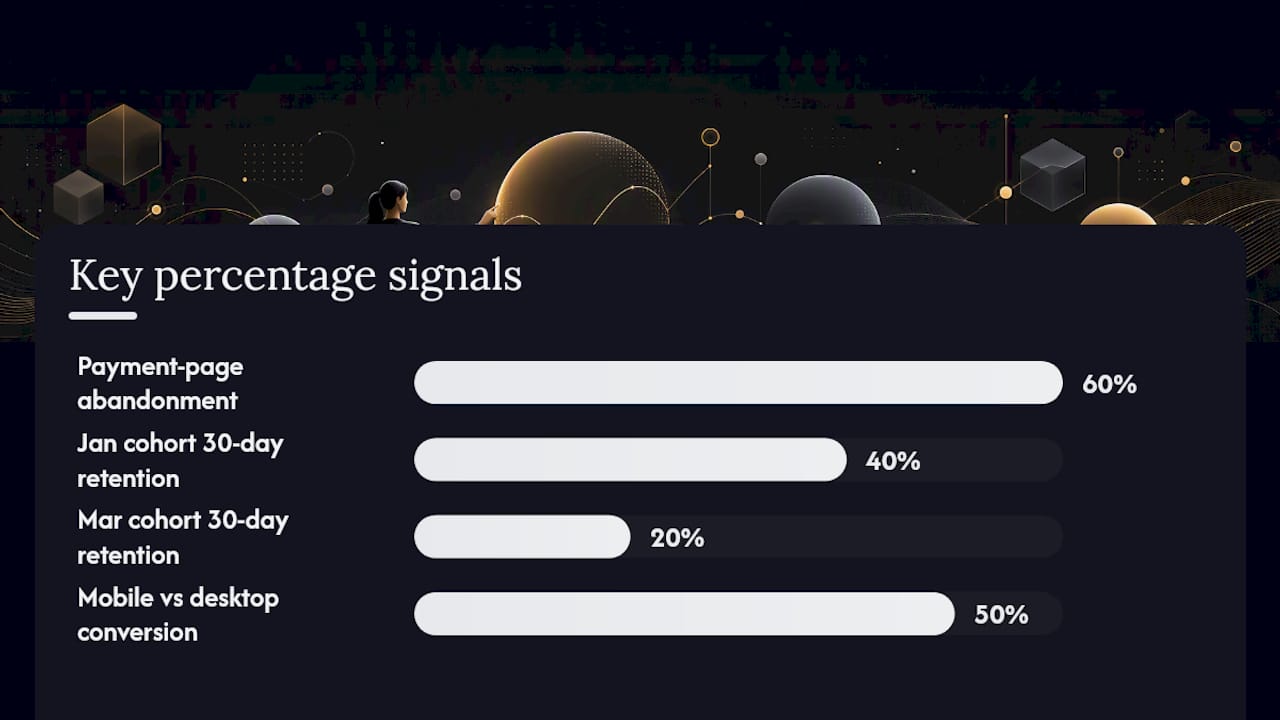
- Segmentation: Split your audience by device, traffic source, geography, or behavior to find groups that convert at different rates. Example: mobile users from paid search convert at half the rate of desktop users from organic. That gap is your optimization target.
- Funnel analysis: Map the steps between entry and conversion, then measure drop-off at each step. A checkout funnel with 60% abandonment at the payment page points to a specific UX or trust problem, not a traffic problem. Pair this with conversion rate optimization techniques to prioritize fixes.
- Cohort analysis: Group users by their first visit date and track how their behavior evolves over weeks or months. If users acquired in January retain at 40% after 30 days but users acquired in March retain at 20%, something changed in your acquisition mix or onboarding.
- Attribution modeling: Assign credit for conversions across the touchpoints that preceded them. Last-click attribution is the default in most platforms but systematically undervalues top-of-funnel channels. Multi-touch attribution models give a more accurate picture of what's actually driving revenue.
- Path analysis: Visualize the sequences of pages or events users follow before converting or exiting. Unexpected paths often reveal navigation problems or content gaps.
Research on longitudinal micro-behavior analysis shows that low-level interactions like scroll depth, mouse movement, and keystroke patterns evolve as users become more familiar with a site. Tracking these over time can predict conversion-related outcomes better than single-session metrics, though it requires aggregation strategies to avoid overfitting short-term noise.
Pro Tip: When running funnel analysis, always segment by device type before drawing conclusions. A funnel that looks healthy in aggregate often has a severe mobile drop-off hidden inside the average.
Privacy, consent, and data governance for analytics
Privacy rules and the shift away from third-party cookies require deliberate planning. In the U.S., the regulatory picture is less prescriptive than GDPR but increasingly complex: California's CCPA and CPRA, Virginia's CDPA, Colorado's CPA, and several other state laws each impose their own consent and opt-out requirements. Federal-level comprehensive privacy legislation remains pending as of 2026.
Practical compliance checklist:
- Implement a consent management platform (CMP) that captures and stores user consent before analytics tags fire.
- Minimize PII collection: avoid passing email addresses, names, or user IDs into analytics platforms unless you have a legal basis and a data processing agreement in place.
- Anonymize or pseudonymize IP addresses at the collection layer.
- Set data retention periods in your analytics platform to match your privacy policy (GA4 allows 2 or 14 months for event data).
- Review vendor data processing agreements annually.
- Provide a clear opt-out mechanism and honor it within the timeframe your applicable state law requires.
For cookieless approaches: server-side collection, first-party cookies scoped to your own domain, and privacy-first analytics tools that avoid fingerprinting are the practical alternatives. Cloudflare's edge analytics model demonstrates that you can measure core site performance without cookies or fingerprinting at all.
Research on large-scale browsing behavior shows that web histories can be strong signals for inferring demographic attributes. That finding cuts both ways: it's useful for targeting, but it also means your analytics data carries more privacy risk than it might appear to on the surface.
Pro Tip: Hash or pseudonymize user identifiers at the event level before they leave your server. Server-side aggregation of sensitive behavioral data is far easier to defend in a regulatory audit than retroactive anonymization of a raw event stream.
Additional privacy-first options to consider:
- First-party data collection via your own CRM and email platform, reducing reliance on third-party signals.
- Consent mode configurations in GA4 that model conversions for users who decline cookies.
- Privacy-preserving measurement APIs (like Google's Privacy Sandbox proposals) as they mature.
Common data quality problems and how to fix them
The most common quality issues are bot traffic contamination, tag misfires, duplicate events, sampling in large datasets, and cross-domain session loss. Each has a concrete fix.
Diagnostic checks and fixes:
- Bot filtering: Enable bot and spider filtering in your analytics platform settings. Check your traffic for sessions with 0-second duration and impossibly high page-per-session counts. A significant share of web traffic is non-human, and unfiltered bot traffic inflates your session counts and distorts engagement metrics.
- Duplicate events: Use GTM's trigger conditions to prevent events from firing multiple times on a single user action. Check the network tab for repeated
/collectcalls on a single click. - Cross-domain session loss: If your funnel spans multiple domains (e.g., a checkout on a subdomain), configure cross-domain measurement in GA4 to stitch sessions correctly.
- Tag misfires: Audit your GTM container quarterly. Orphaned tags, misconfigured triggers, and stale variables accumulate over time and corrupt data silently.
- Sampling: GA4's standard reports are unsampled for most properties, but Explorations can sample at high traffic volumes. Use BigQuery export for unsampled analysis when precision matters.
Recurring maintenance checklist:
- Establish an event naming convention and enforce it across all teams (e.g.,
verb_nounformat:click_cta,submit_form). - Run a weekly QA check on your top five conversion events.
- Run regression tests on your analytics setup after every significant site deployment.
- Review your tag container monthly for unused or conflicting tags.
Pro Tip: When a metric moves sharply, check for a tracking change before assuming a behavioral change. A spike in conversions after a deployment is often a duplicate event firing, not a real lift.
Real-time experiment analytics: what actually works
Real-time signals are useful for monitoring, but they require guardrails to avoid false positives. The temptation to call an experiment early based on a 24-hour trend is one of the most common and costly mistakes in conversion optimization.
Best practices for lightweight experiment analytics:
- Predefine guardrails: Before launching a test, set the metrics that would trigger an early stop (e.g., a 20% drop in checkout completion rate). Don't define these after you see the data.
- Use short windows for safety, longer windows for decisions: Monitor real-time data for regressions in the first 24–48 hours. Wait for statistical significance before making a go/no-go call on the primary metric.
- Track micro-behaviors as leading indicators: Scroll depth, time-on-page, and click patterns often shift before conversion rates do. Longitudinal micro-behavior research confirms that these low-level interactions can predict conversion-related outcomes better than single-session metrics when aggregated over time.
- Segment by device and traffic source from day one: An experiment that wins on desktop and loses on mobile will look neutral in aggregate. You'll ship a change that hurts your largest traffic segment.
Micro-behaviors like scroll depth, mouse movement, and keystroke patterns evolve as users grow familiar with a site. Tracking these longitudinally reveals product-usage learning curves and can predict conversion outcomes more reliably than single-session engagement metrics — but only when aggregated carefully to avoid overfitting short-term noise.
Pro Tip: Combine a fast lightweight metric (click-through rate on the primary CTA) with a delayed high-confidence metric (7-day purchase rate) for experiment decisions. The fast metric tells you whether to keep the test running; the delayed metric tells you whether to ship.
How marketing, product, and UX teams use analytics in practice
Analytics work maps to business outcomes when teams connect a specific question to a specific technique and a specific action. Here's what that looks like across functions.
Marketing campaign measurement:
- Define UTM parameters for every paid and email campaign before launch.
- Track sessions, conversion rate, and cost per acquisition by source and medium.
- Shift budget toward channels with the lowest cost per acquisition and highest retention.
Product onboarding optimization:
- Map the onboarding funnel as a sequence of events (account created → first action → second action → activated).
- Identify the step with the highest drop-off rate.
- Run an A/B test on that step (simplified UI, in-app tooltip, reduced required fields).
Landing page conversion lift:
- Use heatmaps and scroll maps to identify where users stop engaging.
- Segment by traffic source: paid search visitors often have different intent than organic visitors and respond to different page structures.
- Test one variable at a time (headline, CTA copy, form length) and measure against a pre-defined conversion event.
Retention improvement:
- Build a cohort report showing 30-day and 60-day retention by acquisition channel.
- Identify the cohort with the highest retention and analyze what they did differently in their first session.
- Use that behavior pattern to redesign onboarding for lower-retention cohorts.
For a practical walkthrough of conversion improvement steps tied directly to analytics insights, the process follows the same pattern: measure, hypothesize, test, and act on what the data confirms.
How to connect web analytics with your CRM and marketing platforms
Web analytics data becomes significantly more useful when it's connected to your CRM, email platform, and ad accounts. On its own, GA4 tells you that a user from a paid search campaign converted. Connected to your CRM, it tells you that user became a $12,000 annual contract six months later.
The standard integration pattern: pass a consistent user identifier (a hashed email or CRM ID) through your data layer, capture it in your analytics events, and use that ID to join web behavior data with CRM records in a data warehouse like BigQuery or Snowflake. This enables lifetime value analysis by acquisition channel, something no standalone analytics platform can do without external data.
For ad platforms, import conversion events from GA4 into Google Ads to enable smart bidding on actual business outcomes rather than proxy metrics. The same principle applies to Meta's Conversions API, which uses server-side event data to improve attribution accuracy when browser-based tracking is blocked.
Marketing automation platforms like HubSpot and Marketo can receive web behavior data via their tracking scripts, then use page visit sequences to trigger email workflows. A user who visits your pricing page three times without converting is a strong signal for a sales follow-up, but only if your analytics and CRM are talking to each other.
How to benchmark your analytics data against industry standards
Benchmarking tells you whether that number is strong for your industry and traffic mix or whether it's a sign of a broken funnel.
The most reliable benchmarking sources for U.S.-based sites are platform-level reports from Google, industry research from Nielsen and Forrester, and competitive intelligence tools like SimilarWeb that estimate traffic and engagement for specific domains.
Set targets by starting with your own historical baseline, not an industry average. Once you have six months of clean data, layer in competitive benchmarks to calibrate whether your trajectory is fast enough.
Segment benchmarks by device, traffic source, and geography before comparing. A mobile conversion rate benchmark from a desktop-heavy industry report will mislead you if most of your traffic is mobile.
How to build dashboards that different stakeholders will actually use
The mistake most analytics teams make is building one dashboard for everyone. Executives want revenue impact and trend lines. Marketing managers want campaign performance by channel. Product managers want funnel completion rates and feature adoption. UX designers want session-level behavior data. One dashboard that tries to serve all four audiences serves none of them well.
Build role-specific views with a clear primary metric at the top, supporting context below, and no more than five to seven data points per view. GA4's custom reports and Looker Studio (formerly Google Data Studio) both support this pattern without requiring a data engineering team.
For executive dashboards: weekly revenue, conversion rate trend, and top acquisition channels. For marketing dashboards: campaign spend, sessions, conversion rate, and cost per acquisition by channel. For product dashboards: funnel completion rates, feature adoption events, and retention cohorts. For UX dashboards: scroll depth, click maps, and task completion rates by page.
Automate delivery. A dashboard that requires someone to log in and pull data gets ignored. A weekly email with a PDF snapshot of the five metrics that matter gets read.
Why regular analytics audits protect your data accuracy
An analytics setup that was accurate six months ago may not be accurate today. Site deployments break tags. GTM containers accumulate orphaned configurations. New pages launch without tracking. Conversion events get renamed without updating the analytics platform.
A quarterly audit should cover: tag firing verification across all key page templates, event naming consistency, conversion event accuracy (complete the action yourself and verify it records), cross-domain session stitching, bot filter status, and data retention settings. Run the audit after every major site redesign, not just on a calendar schedule.
Monthly, check for anomalies in your baseline metrics that don't correspond to known traffic or campaign changes. A sudden drop in conversion rate on a Tuesday with no campaign change is almost always a tracking problem, not a behavioral shift.
Annual audits should include a review of your data processing agreements with all analytics vendors, a check of your consent management platform's consent rates by region, and a reassessment of whether your current tool stack still fits your measurement needs.
How to set up goal and conversion tracking tied to business objectives
Conversion tracking is only useful when the events you track map directly to outcomes your business cares about. A "goal" in your analytics platform should represent a real business action, not a proxy metric you're tracking because it's easy to measure.
Start by listing your business objectives in plain language: generate leads, sell products, retain subscribers, activate free trial users. Then map each objective to a specific user action on your site: form submission, purchase confirmation page view, subscription renewal event, onboarding completion event.
In GA4, configure these as key events (formerly "conversions") in your property settings. Each key event should have a clear name following your naming convention, a verified firing condition, and a documented expected volume so you can spot anomalies quickly.
For e-commerce, enable GA4's enhanced e-commerce events: view_item, add_to_cart, begin_checkout, purchase. These give you a complete funnel from product discovery to transaction without custom event configuration. For lead generation, the minimum is a generate_lead event on form submission with the form name passed as a parameter.
Revisit your conversion event list every quarter. Business priorities shift. An event that mattered six months ago may no longer reflect what success looks like for your team.
The analytics priorities that actually matter for small teams
Most analytics advice is written for teams with dedicated data engineers and six-figure tool budgets. For small marketing teams and SMBs, the trade-offs look different.
Pragmatic trade-offs worth naming:
- Speed vs. accuracy: A fast, approximate answer from a lightweight analytics tool beats a precise answer that takes three weeks to extract from an enterprise platform. Start with what you can act on.
- Privacy vs. granularity: Cookieless and server-side collection reduce data richness but also reduce compliance risk. For most SMBs, the compliance risk of aggressive tracking outweighs the marginal insight from granular user-level data.
- DIY vs. managed: Setting up GA4 and GTM yourself is free and teaches you how the system works. But if your team doesn't have the bandwidth to maintain it, a misconfigured setup is worse than a simple one that's accurate.
For small teams: start with GA4 and GTM, define three to five conversion events, build one dashboard per stakeholder type, and run a monthly QA check. That's enough to make data-driven decisions without drowning in configuration. Add experimentation and session replay tools once you have clean baseline data to work from.
Gostellar makes real-time experimentation analytics fast and lightweight
If you've built a solid analytics foundation and you're ready to run experiments, the next gap is usually speed: most A/B testing setups require developer time, slow down page loads, or produce data you can't act on until the test has run for weeks.

Gostellar is built for exactly this stage. Its 5.4KB script adds virtually no load time, so your experiment infrastructure doesn't become a performance liability. The no-code visual editor lets marketers set up tests without touching the codebase. Real-time analytics surface guardrail metrics within hours of launch, and advanced goal tracking connects experiment results directly to the conversion events you've already defined. There's a free plan for sites under 25,000 monthly tracked users, which means small teams can run real experiments without a tool budget.
Start your first experiment with Gostellar and see how fast a properly instrumented test can move from hypothesis to decision.
Sources
The sources below are the primary references for this guide, selected for technical authority and relevance to U.S.-based analytics practitioners.
- Web analytics
- Ahrefs Web Analytics | Simple Google Analytics alternative
- Cloudflare Web Analytics | Cloudflare
- Who Does What on the Web: A Large-Scale Study of Browsing Behavior | Proceedings of the International AAAI Conference on Web and Social Media
- Longitudinal Analysis of Low-Level Web Interaction through Micro Behaviours | Proceedings of the 26th ACM Conference on Hypertext & Social Media
- SimilarWeb
- Statista - share of website traffic from mobile devices (USA)
Recommended
Published: 8/9/2026