
How to Do A/B Testing: A Step-By-Step Guide for Marketers
A/B testing is a controlled experiment where you show two versions of something (a control and a variant) to live traffic and measure which one moves a primary metric more. It's a statistical method, not a guessing game, and it only works when you follow the sequence: goal, hypothesis, sample size, launch, analysis, decision.
Here's the minimal path to your first test:
- Define one goal and one primary metric (signup rate, checkout completion, click-through).
- Write a specific hypothesis naming the change, the metric, and why you expect it to move.
- Build a control and one variant that differ by exactly one meaningful element.
- Calculate your sample size before launch, not after.
- Run it to completion without peeking at results daily and calling it early.
Pro Tip: Most teams run tests at a 95% confidence level and treat roughly 1,000 visitors per variation as a rough floor for ecommerce experiments, as per Shopify's testing guidance. Below that, plan on a longer runtime or a bigger swing.
Key Takeaways
A/B testing produces trustworthy results only when a specific hypothesis, a calculated sample size, and a fixed stopping rule are in place before launch.
| Point | Details |
|---|---|
| Write a specific hypothesis | Name the variable, the metric, and the direction of change before building anything. |
| Calculate sample size first | Use baseline conversion, MDE, 80% power, and 5% significance to size the test before launch. |
| Run a full business cycle | Cover at least 7 to 14 days and hit your sample size, never stop early on a good-looking day. |
| QA before and during | Run an A/A test, check sample-ratio mismatch, and confirm event tracking before trusting results. |
| Separate significance from impact | A statistically significant result still needs a practically meaningful effect size to ship. |
| Use a purpose-built tool | Gostellar's no-code editor and deterministic bucketing handle the assignment and QA steps this guide covers. |
Table of Contents
- When Should You Run an A/B Test?
- How Do You Plan a Test and Write a Hypothesis?
- How Do You Design a Test and Calculate Sample Size?
- How Do You Implement a Test Without Breaking the Data?
- How Long Should You Run an A/B Test?
- How Do You Analyze and Interpret A/B Test Results?
- A Worked Example: Testing a Landing Page CTA Button
- What Pitfalls Undermine A/B Testing Results?
- When Should You Move Beyond Simple A/B Tests?
- What Should You Look for in an A/B Testing Tool?
- How Gostellar Supports Every Step of This Process
- Ready to Run Your First Test?
- What Experienced Teams Get Wrong About A/B Testing
- Frequently Asked Questions
- Sources
When Should You Run an A/B Test?
A/B testing earns its keep on pages and flows with enough repeat traffic to produce a clean signal in a reasonable window. Landing pages, email subject lines, pricing pages, and onboarding screens are the classic candidates because visitors hit them constantly and the outcome (click, signup, purchase) is easy to measure.
The variable that actually decides whether testing makes sense is volume, not ambition. A site pulling a few hundred visitors a month can technically run a test, but it might take months to reach a trustworthy sample. In that situation, Shopify recommends leaning on qualitative research, session recordings, or user interviews instead, or shipping bigger, more confident changes rather than testing small tweaks nobody will notice statistically.
A/B testing answers a narrow question well: does this specific change, on live users, move this specific metric? It doesn't tell you why users behave the way they do, and it can't validate a redesign that hasn't launched yet. Good candidates for early tests include:
- Headline and CTA copy on high-traffic landing pages
- Email subject lines with list sizes over a few thousand
- Checkout flow friction points (form length, payment options)
- Onboarding sequences with measurable activation steps
If you're short on traffic, a beginner's guide to A/B testing for small businesses walks through how to scope tests realistically at lower volume.
How Do You Plan a Test and Write a Hypothesis?
Every reliable test starts with a plan, not a design tool. That means picking a primary metric, naming a guardrail metric that protects you from a false win, and writing a hypothesis specific enough to fail.
Your primary metric is the one number that decides whether the test wins. A guardrail metric is the one you watch so a win on paper doesn't hide a real loss. If you're testing a more aggressive checkout flow, conversion rate might climb while refund rate quietly rises with it. Common pairs marketers rely on:
- Conversion rate (primary) with average order value (guardrail), to catch a discount-driven lift that hurts margin.
- Signup rate (primary) with 7-day retention (guardrail), to catch low-quality signups from a misleading headline.
- Click-through rate (primary) with bounce rate on the next page (guardrail), to catch clickbait that doesn't convert downstream.
Once your metrics are set, write the hypothesis in a format you can actually test: "I believe changing [variable] will increase [metric] by [direction] because [user insight]." According to NN/g's research on A/B testing, a strong hypothesis pairs a specific change with a measurable outcome and a reason grounded in real user behavior, not a hunch.
Compare these side by side:
Weak: "Let's test a new button color and see what happens." Strong: "I believe changing the CTA from 'Submit' to 'Get My Free Quote' will increase click-through rate by at least 10% because heatmap data shows users hesitate at generic labels."
Weak: "Try a shorter signup form." Strong: "I believe removing the phone number field will increase signup completion by 8% because 22% of form abandonments happen right after that field, based on funnel analytics."
Once you've got a backlog of hypotheses, prioritize by impact times ease. A test that could lift revenue on your highest-traffic page but takes an engineer two days to build usually beats a low-impact test that's easy to ship. Score each idea on a simple 1 to 5 scale for both dimensions and multiply them; run the highest scores first. Tools like the landing page prioritization frameworks marketers use for backlog scoring apply the same logic to broader test programs, and a metrics monitoring guide can help you settle on guardrails before you build anything.
How Do You Design a Test and Calculate Sample Size?
Design comes down to two decisions: how many things you're changing at once, and how many visitors you need before the result means anything. Get either one wrong and the data lies to you.
A single-variable test changes one element (headline, image, button copy) and isolates its effect cleanly. A multivariate test changes several elements simultaneously and measures their combinations, which requires dramatically more traffic to reach significance on each combination. Unless you're running a high-traffic site with tens of thousands of weekly conversions, stick to single-variable tests. They're faster to build, faster to read, and far less likely to produce a false positive from a confounded design.
Sample size is where most beginner tests fall apart, usually because nobody calculated one before launch. Four inputs determine it, according to Tajo's guide to split testing:
- Baseline conversion rate, the current performance of your control.
- Minimum detectable effect (MDE), the smallest lift you actually care about catching.
- Statistical power, commonly set at 80%, which is your odds of detecting a real effect if one exists.
- Significance level, commonly set at 5%, which caps your odds of a false positive.
The relationship between these is intuitive once you see it: a smaller MDE requires a bigger sample, because subtle effects hide inside natural noise. Trying to detect a 2% lift takes far more visitors than detecting a 20% lift. Low baseline conversion rates also inflate sample size, because rare events need more trials to show a stable pattern.
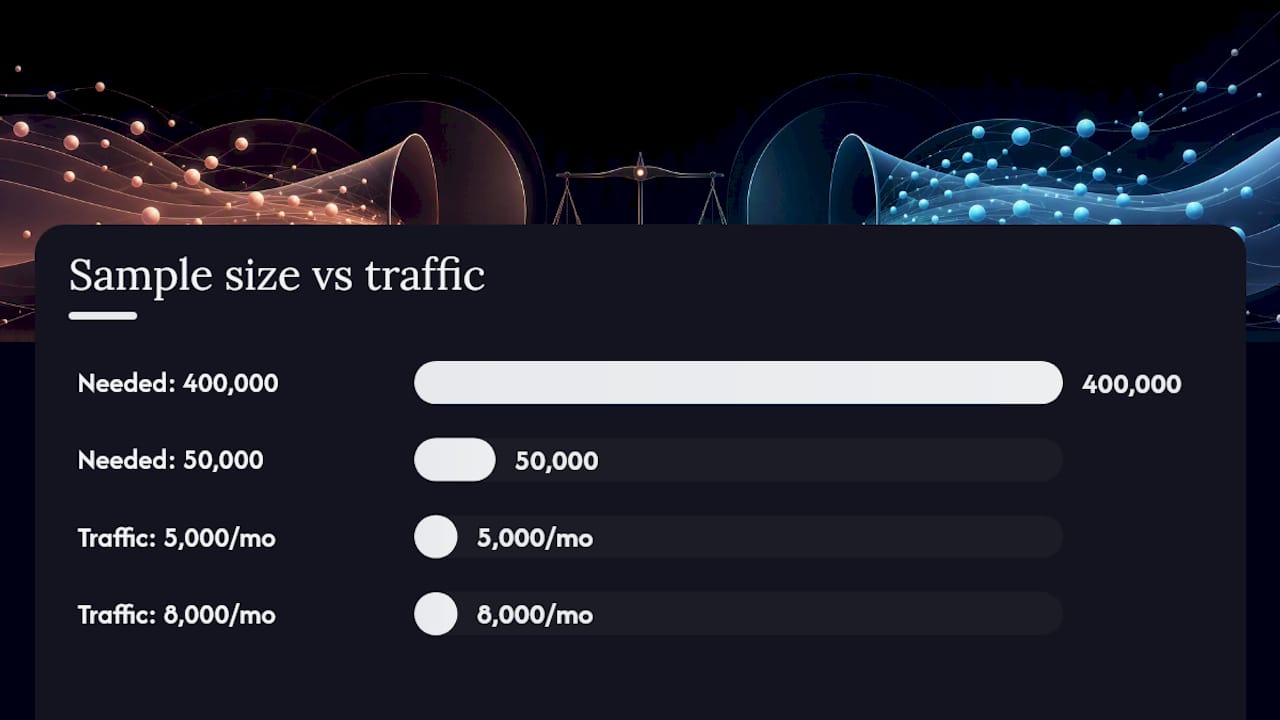
You don't need to run the math by hand. Free calculators from Evan Miller, Optimizely, and most testing platforms will take your baseline rate, MDE, and desired power and spit out a required sample size per variant instantly. What you do need to know is the rule of thumb for viability: if your calculator tells you a test needs 400,000 visitors per variation and you get 5,000 a month, that test isn't viable at that MDE. Either accept a larger MDE (test for a bigger, more obvious lift) or pick a different page with more traffic.
Pro Tip: Run your sample-size number backward as a sanity check. If the calculator says you need 50,000 visitors per variant and your landing page gets 8,000 monthly visitors, don't shrink the number to fit your traffic. Shrink your ambition instead, and test for a bigger effect you can actually detect in a reasonable window.
On duration, most guides converge on the same rule: run until you've hit your calculated sample size and completed at least one full business cycle, typically 7 to 14 days. Stopping after four days because the numbers looked good on a Tuesday ignores weekday and weekend behavior differences, which is a common way beginner tests mislead their owners according to discussions on test planning by days versus sample size.
How Do You Implement a Test Without Breaking the Data?
Implementation is where good hypotheses go to die, usually from something boring: a tracking pixel firing twice, or half your mobile traffic never getting bucketed at all. Data quality problems here don't just weaken your test, they invalidate it silently, and you won't find out until you've already shipped the wrong version.
The foundation is deterministic bucketing. Every visitor needs a stable identifier (a hashed user ID or persistent cookie) that assigns them to the same variant every time they return, across sessions and devices where possible. Random assignment on every page load means the same person could see the control on one visit and the variant on the next, which corrupts both your traffic split and your ability to measure a real user journey.
Before launch, run through this checklist:
- A/A test the setup first. Split traffic 50/50 between two identical experiences and confirm the metrics come back statistically flat. If an A/A test shows a "winner," your instrumentation is broken.
- Check for sample-ratio mismatch. If you're splitting 50/50 and one variant is quietly getting 55% of traffic, something in your randomization or exclusion logic is off.
- Deduplicate events. Confirm your analytics platform isn't double-counting conversions from page refreshes, back-button navigation, or retry logic on form submissions.
- Test cross-device behavior. A user who starts on mobile and finishes on desktop should ideally stay in the same bucket, or you need to account for the mismatch in your analysis.
- Validate the full data pipeline. Trace a test conversion from the click event to your dashboard before trusting a single number it reports.
According to ABTesting.cc's implementation guidance, the most common failure modes at this stage are double-firing events, inconsistent variant assignment across page types, and caching layers that serve a stale variant to returning visitors. All three are detectable with an A/A test and a few manual click-throughs before you ever open the test to real traffic. A dedicated A/B testing tool for landing pages handles the random split and event tracking automatically, which removes most of the manual error that creeps into homegrown scripts.
Pro Tip: Screen record yourself clicking through both the control and the variant on three different browsers before launch. It takes ten minutes and catches the caching bugs that no amount of code review will.
How Long Should You Run an A/B Test?
Run your test until you hit the pre-calculated sample size and have covered a full business cycle, whichever takes longer. Cutting a test short because early results look promising often leads to unreliable conclusions.
Stopping rules come in two flavors. A fixed-sample test commits to a sample size in advance and doesn't look at significance until that number is reached; this is the standard approach and the one most calculators assume. A sequential test uses statistical methods designed to let you check results continuously without inflating your false-positive rate, but it requires a purpose-built engine. Peeking at a fixed-sample test daily and stopping the moment you see a "significant" result is, according to ABTesting.cc, one of the most reliable ways to manufacture a false win. If your business genuinely needs to stop early, use a sequential-testing tool or a pre-defined alpha-spending rule, not a hopeful glance at the dashboard.
While the test runs, monitor these three things:
- Sample-ratio mismatch. A skewed split partway through usually means a bug, not bad luck.
- Sudden traffic shifts. A marketing campaign, a press mention, or a bot spike mid-test can distort your data in ways that don't reflect normal behavior.
- Instrumentation drift. Confirm your metric definitions haven't changed (a new tracking pixel deployed by another team is a classic silent killer).
If you spot a production issue, pause the test, fix the root cause, and consider restarting the clock rather than patching the data after the fact. A test built on three days of broken tracking and four clean days isn't a seven-day test. It's two different tests stitched together.
How Do You Analyze and Interpret A/B Test Results?
Reading results correctly is where the discipline pays off or falls apart. Three concepts matter most: the p-value, the confidence interval, and the difference between statistical and practical significance.
A p-value tells you how likely you'd be to see a result this extreme (or more extreme) if there were actually no difference between your control and variant. According to the statistical framework laid out in Inferential Thinking's chapter on A/B testing, this comes from comparing your observed outcome against a simulated distribution built by randomly shuffling the data under the assumption of no effect, a technique called a permutation test. A p-value under 0.05 is the conventional threshold for calling a result statistically significant, meaning the observed gap is unlikely to be random noise.
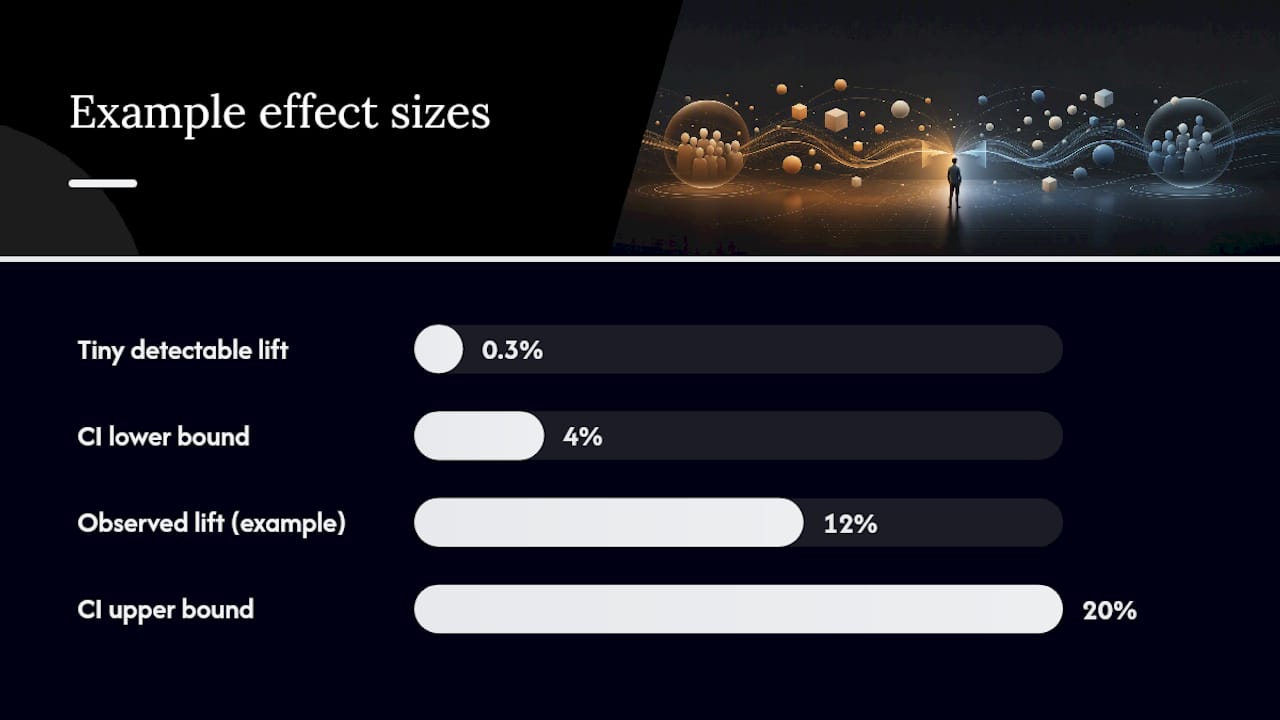
A confidence interval gives you a range, not a single number. Instead of saying "the variant lifted conversion by 12%," a proper confidence interval says "we're 95% confident the true lift is somewhere between 4% and 20%." That range matters because a wide interval, even one that clears statistical significance, tells you the estimate is shaky and might not hold up in a follow-up test.
Statistical significance and practical significance are not the same thing, and conflating them causes real damage. A test with enough traffic can detect a statistically significant 0.3% lift that's real but too small to justify engineering time to ship. Before declaring a winner, run through this checklist:
- Is the result statistically significant at your pre-defined threshold (commonly p < 0.05)?
- Is the effect size practically meaningful given the cost of implementing the change?
- Did the sample-ratio check pass throughout the test, not just at the end?
- Did guardrail metrics stay stable or move in an acceptable direction?
If you're running several tests simultaneously, or testing many variants against one control, your odds of a false positive climb with every additional comparison. This is the multiple testing problem, and the standard fix is a correction method like Bonferroni, which tightens your significance threshold in proportion to how many comparisons you're running. Skip this step and a program running ten tests a month will manufacture "wins" that are pure noise roughly once every couple of tests.
A null result, one where neither version wins clearly, isn't a wasted test. According to Shopify's guidance on iterative testing, a null result tells you the variable you changed doesn't matter to users as much as you thought, which redirects your next hypothesis toward a bigger, more meaningful lever instead of a cosmetic tweak.
There's also a philosophical fork most marketers never hear about: frequentist versus Bayesian analysis. The frequentist approach (p-values, fixed significance thresholds) asks "how surprising is this data if there's truly no effect?" The Bayesian approach instead asks "given this data, what's the probability the variant is actually better?" and updates a belief rather than testing against a fixed null. Most mainstream testing tools default to frequentist methods because they're simpler to standardize across a whole organization, but Bayesian dashboards are becoming more common in tools built for continuous monitoring.
A Worked Example: Testing a Landing Page CTA Button
If your landing page gets 6,000 visitors a week, that's about a 2 to 3 week test, comfortably covering more than one full business cycle.
Here's what a simulated outcome might look like at the end of the run:
Run the numbers through your significance test and, assuming the p-value lands under 0.05 and the confidence interval doesn't cross zero, you'd ship the variant. If the p-value came back at 0.14, you'd have a directionally positive but statistically inconclusive result, which means you either extend the test, accept the ambiguity, or treat it as a null and move to the next hypothesis.
Before trusting that table, run this scenario-specific QA pass:
- Confirm the new CTA button fires the same conversion event as the original, not a different tag that undercounts it.
- Check that both variants render correctly on mobile, since a broken mobile layout can tank one variant's numbers for reasons that have nothing to do with copy.
- Verify the 8,500/8,500 split is close to even. A skew to 9,200/7,800 signals a bucketing problem worth investigating before you trust the conversion rates.
- After the test ends, spot-check a sample of "converted" sessions in your analytics tool to confirm they're real conversions, not bot traffic or internal team clicks.
A conversion improvement guide covers additional CTA variables worth testing once this first result gives you a direction to build on.
What Pitfalls Undermine A/B Testing Results?
Most bad test results trace back to a handful of repeatable mistakes, not bad luck. Stopping early tops the list: checking results daily and calling the test the moment it crosses significance inflates your false-positive rate dramatically, because you're effectively running dozens of mini-tests instead of one. Fix it by committing to your sample size before launch and not looking at significance until you hit it.
Testing changes too small to matter is the second trap. Swapping a button from navy to slightly-darker-navy rarely produces a detectable effect, and a null result on a trivial change teaches you nothing. Save your first tests for changes with real hypothesized impact.
Running overlapping experiments on the same user path is a quieter problem. If your homepage headline test and your checkout flow test both touch users who convert through both pages, the two tests can interact and muddy each other's results. Keep a test registry so your team can see what's live where.
Seasonality and novelty effects distort results in opposite but equally misleading ways. A test launched right before a holiday sale will show conversion patterns that have nothing to do with your variant. A dramatic redesign might spike engagement simply because it's new, an effect that fades within days as users adjust, a pattern the systematic literature review on experimentation practices identifies as a recurring open challenge in the field. Control for both by running tests across full weeks and, where possible, avoiding launch windows around major promotional events unless you're specifically testing for them.
- Stopping before reaching your calculated sample size
- Testing changes too minor to produce a measurable signal
- Running overlapping tests on shared user paths without a registry
- Ignoring seasonality by launching around holidays or promotions
- Treating a novelty-driven spike as a permanent lift
Pro Tip: Keep a shared test registry, even a simple spreadsheet, logging what's live, on which pages, and for which user segments. It's the single cheapest way to catch overlapping tests before they contaminate each other's data.
Best practice for test hygiene comes down to governance: one owner per test, a documented hypothesis before launch, and a fixed decision date nobody moves once the test starts. Reviewing tactics for conversion rate optimization alongside your testing calendar helps keep hypotheses grounded in real user friction rather than arbitrary guesses.
When Should You Move Beyond Simple A/B Tests?
Once you've run enough single-variable tests to trust your process, segmentation is the natural next step. New visitors and returning visitors often respond to completely different messaging, and testing them as one blended audience can hide a real effect that only shows up in one group. Running the same test split by segment, rather than pooled, often surfaces wins a blended analysis misses entirely, a pattern Wikipedia's overview of A/B testing notes as a common evolution for high-traffic teams.
From there, personalization and feature-flag rollouts extend the same logic further: instead of a single control-versus-variant split, you gradually roll a change out to defined user cohorts and monitor metrics per cohort before a full launch. This requires more mature tooling and clearer ownership, since a bug can now affect one segment invisibly while looking fine in your aggregate dashboard.
Scaling an experimentation program safely means putting governance in place before volume grows:
- Assign clear feature ownership so nobody ships conflicting changes to the same page
- Maintain a central test registry visible to the whole team
- Set consistent significance thresholds per audience segment instead of ad hoc calls per test
- Require an A/A validation pass any time you change your assignment or tracking infrastructure
What Should You Look for in an A/B Testing Tool?
Testing tools generally fall into three categories: visual no-code editors built for marketers, SDK-first platforms built for engineering-led product teams, and data-warehouse-native engines that run analysis directly on your existing data infrastructure. Which one fits depends on who's building the tests and how deeply they need to integrate with your product.
Regardless of category, a handful of features separate a tool that protects your data from one that quietly corrupts it:
- Deterministic bucketing that keeps the same visitor in the same variant across sessions and devices
- Built-in sample-size and power calculators so you're not exporting data to a third-party spreadsheet
- Sequential-testing support for teams that need to check results before a fixed end date without inflating false positives
- Analytics integrations that sync conversion events with your existing dashboards instead of creating a second source of truth
- A lightweight script that doesn't slow page load, since a sluggish test script can itself depress conversion rates and bias your result
Client-side testing tools (which swap content in the browser after page load) are easier to set up but can introduce a visible flicker and add to page weight. Server-side testing renders the correct variant before the page loads, which protects performance and privacy but requires more engineering coordination. A comparison of A/B testing platforms breaks down these tradeoffs by team size and technical resources if you're weighing which category fits your setup.
How Gostellar Supports Every Step of This Process
Gostellar was built around the exact sequence outlined above, from hypothesis to decision. The no-code visual editor lets marketers build a control and variant without waiting on engineering, which matters most in the plan and design stages where speed to launch determines how many tests you can actually run in a quarter.
On the implementation side, Gostellar handles deterministic bucketing automatically, so the same visitor consistently sees the same variant across sessions, addressing the exact assignment errors covered in the implementation checklist above. The platform's script weighs in at 5.4KB, light enough that it shouldn't introduce the kind of load-time drag that can quietly bias a conversion test. Real-time analytics dashboards give you the sample-ratio and metric visibility needed to monitor a live test without exporting data elsewhere.
A few practical notes for teams evaluating fit:
- Direct integrations with WordPress, Shopify, Webflow, Wix, Squarespace, Framer, and Bubble mean setup doesn't require a developer sprint.
- Dynamic keyword insertion supports the personalization and segmentation techniques covered above once you're ready to move past single A/B tests.
- A free plan is available for businesses tracking under 25,000 monthly users, useful for teams running their first few tests before committing to a paid tier.
Pro Tip: If you're new to experimentation, start with the free tier on your highest-traffic landing page. It's the fastest way to validate your whole process, from hypothesis to QA to decision, before you scale to more tests per month.
Ready to Run Your First Test?
Everything in this guide, from sample-size math to QA checklists, assumes you have a tool that handles the mechanical parts correctly so you can focus on the hypothesis and the decision. Gostellar's visual editor builds your variant without code, its deterministic bucketing keeps assignment consistent across sessions, and its lightweight script means the tool itself won't be the reason your conversion numbers look off.

If you've been putting off your first test because the setup felt like a bigger lift than the marketing team had time for, that's usually a tooling problem, not a skills problem. Gostellar's dynamic keyword insertion and real-time analytics dashboard mean you can go from hypothesis to a live test on WordPress, Shopify, Webflow, or Wix in an afternoon rather than a sprint. Start on the free plan to run your first test against real traffic before committing to anything, and see whether the process laid out in this guide holds up on your own landing page.
What Experienced Teams Get Wrong About A/B Testing
The biggest gap I see isn't statistical, it's organizational. Teams treat their backlog of test ideas like a wish list instead of a prioritized queue, so the loudest opinion in the room gets tested before the highest-impact hypothesis does. Score ideas by impact and ease before you argue about which one "feels right."
The second miss is abandoning a losing test instead of mining it. A null result on a strong hypothesis usually means the underlying insight was wrong, not that testing failed, and that's worth writing down.
Keep a test registry from day one, even a simple spreadsheet with hypothesis, dates, and outcome. Six months in, it becomes the most valuable document your team owns.
Frequently Asked Questions
How long should an A/B test run before I trust the results? Run until you hit your pre-calculated sample size and have covered at least one full business cycle, typically about one to two weeks. Stopping earlier because results look promising is the fastest way to ship a false positive.
What sample size do I need for an A/B test? It depends on your baseline conversion rate and your minimum detectable effect.
Can I run an A/B test with low traffic? You can, but it may take much longer to reach a reliable sample size. Below a few thousand monthly visitors, consider testing for a bigger effect, extending your timeline, or pairing quantitative tests with qualitative research.
What's the difference between statistical significance and a meaningful result? Statistical significance means the observed difference is unlikely to be random noise. Practical significance means the effect is large enough to justify the cost of implementing it. A test can clear one threshold without clearing the other.
What should I do if my A/B test comes back inconclusive? Treat it as a learning, not a failure. An inconclusive or null result tells you the variable you changed doesn't matter as much as expected, which should redirect your next hypothesis toward a bigger, more meaningful change.
Sources
For the statistical foundation behind p-values and permutation tests, the Inferential Thinking chapter on A/B testing walks through the math with worked examples. For hypothesis design and hearing directly from UX researchers, NN/g's A/B testing 101 remains one of the clearest references available. For a broader look at where the field still has open questions, the systematic literature review on experimentation practices covers research gaps and common role structures on experimentation teams.
- A/B Testing: How To Run a Statistically Significant A/B Test (2026) - Shopify
- A/B Testing 101 - NN/g
- A/B Testing: The Complete Guide to Split Testing for Marketing (2026)
Recommended
Published: 8/19/2026