
P and B Testing for SMBs: A Practical 2026 How-To
"P and b testing" is the informal name for A/B testing, the practice of splitting your audience between two versions of a page, email, or feature and measuring which one drives better outcomes. The industry term is A/B testing or split testing, and the operating rules are non-negotiable: target 95% confidence (p < 0.05), calculate your required sample size before you launch, and run for at least two full business cycles (typically two weeks minimum). Skip any of those three and your results are noise dressed up as data.
Here is what this guide covers, in the order you should work through it:
- Write a testable hypothesis with an if/then/because structure
- Pick a primary metric and at least two guardrail metrics
- Calculate sample size from four inputs before touching your testing tool
- Run the test with proper randomization and no peeking
- Read results correctly, segment findings, and decide whether to ship or re-test
- Know when low traffic makes A/B testing the wrong tool entirely
Start with sample size. Everything else depends on it.
Key Takeaways
| Point | Details |
|---|---|
| Hit 95% confidence | Target p < 0.05; never ship a result below this threshold. |
| Calculate sample size first | Use four inputs: baseline rate, MDE, significance level, and power before building any variant. |
| Run at least two business cycles | Two weeks minimum captures weekly traffic patterns; four weeks is better for seasonal sites. |
| Guardrail metrics protect you | A primary metric win that degrades revenue per visitor or lead quality is not a real win. |
| Gostellar for SMB testing | Gostellar's 5.4KB script, no-code editor, and built-in goal tracking let small teams run rigorous tests without engineering support. |
Table of Contents
- What every p and b test needs: a before/during/after checklist
- How to write a hypothesis and choose metrics that actually matter
- How to calculate sample size, MDE, and statistical power
- Running the test: randomization, QA, and timing
- What to do when you don't have enough traffic
- How to read results and decide what to do next
- Tool and workflow features that make SMB testing reliable
- The part most guides skip
- Gostellar runs tests the way this guide describes
- Sources
What every p and b test needs: a before/during/after checklist
A defensible test is a planned test. HubSpot's A/B testing guidance recommends defining goals and preventing concurrent experiments on the same page as two of the most critical pre-launch steps. Here is the full checklist.
Before launch:
- Write a hypothesis in if/then/because form (example: "If we change the CTA copy from 'Submit' to 'Get my free quote,' then form completions will increase, because the new copy signals a clear benefit")
- Define one primary metric and two or more guardrail metrics
- Calculate required sample size (see Section 4)
- Confirm your analytics events fire correctly on both variants
- Verify conversion tracking is live and attributed to the right goal
- Check variant rendering across desktop, mobile, and major browsers
- Confirm no other test is running on the same page or funnel step
- Set a fixed end date based on your sample-size estimate and traffic rate
During the test:
- Do not look at significance until the pre-specified end date
- Monitor for technical errors (broken variants, tracking gaps) daily
- Watch for external events (promotions, PR spikes) that could contaminate results
After the test:
- Analyze primary metric first, then guardrail metrics
- Segment results by device, traffic source, and new vs. returning visitors
- Log the outcome in a test registry with hypothesis, result, and next step
- If shipping the winner, monitor guardrail metrics for at least two business cycles post-rollout
Pro Tip: Build your test registry in a shared doc or spreadsheet from day one. Teams that log every test, including inconclusive ones, compound learning faster than teams that only document wins.
How to write a hypothesis and choose metrics that actually matter
A hypothesis without a "because" is just a guess. The if/then/because format forces you to articulate the mechanism, which makes the result interpretable whether you win or lose.
Your primary metric must connect directly to revenue or a key funnel outcome. Clicks and scroll depth are fine as diagnostic signals, but they are poor primary metrics because a variant can lift clicks while reducing paid conversions. Guardrail metrics exist to catch exactly that failure mode. Nielsen Norman Group notes that a lift in a front-end metric can still harm business health if lead quality or revenue per visitor drops.
Good guardrail candidates for most SMB tests:
- Revenue per visitor
- Lead quality score (if your CRM tracks it)
- Checkout completion rate (when testing above-the-fold elements)
- Bounce rate on the next funnel step
Choose your segmentation variables before launch: device type, traffic source, and new vs. returning visitors are the three that most often reveal cross-segment reversals. If a variant wins on desktop but loses on mobile, shipping it globally is a mistake.
Pro Tip: Prefer metrics that are hard to game and reflect downstream value. Revenue per visitor is harder to inflate accidentally than click-through rate, and it tells you something the CFO actually cares about.
How to calculate sample size, MDE, and statistical power
Four inputs determine how many visitors you need per variant, as outlined in Kolonell's SMB A/B testing guide:
Scandiweb's e-commerce A/B testing framework provides a practical approximation formula:
n per variant ≈ 16 × p × (1 − p) / δ²
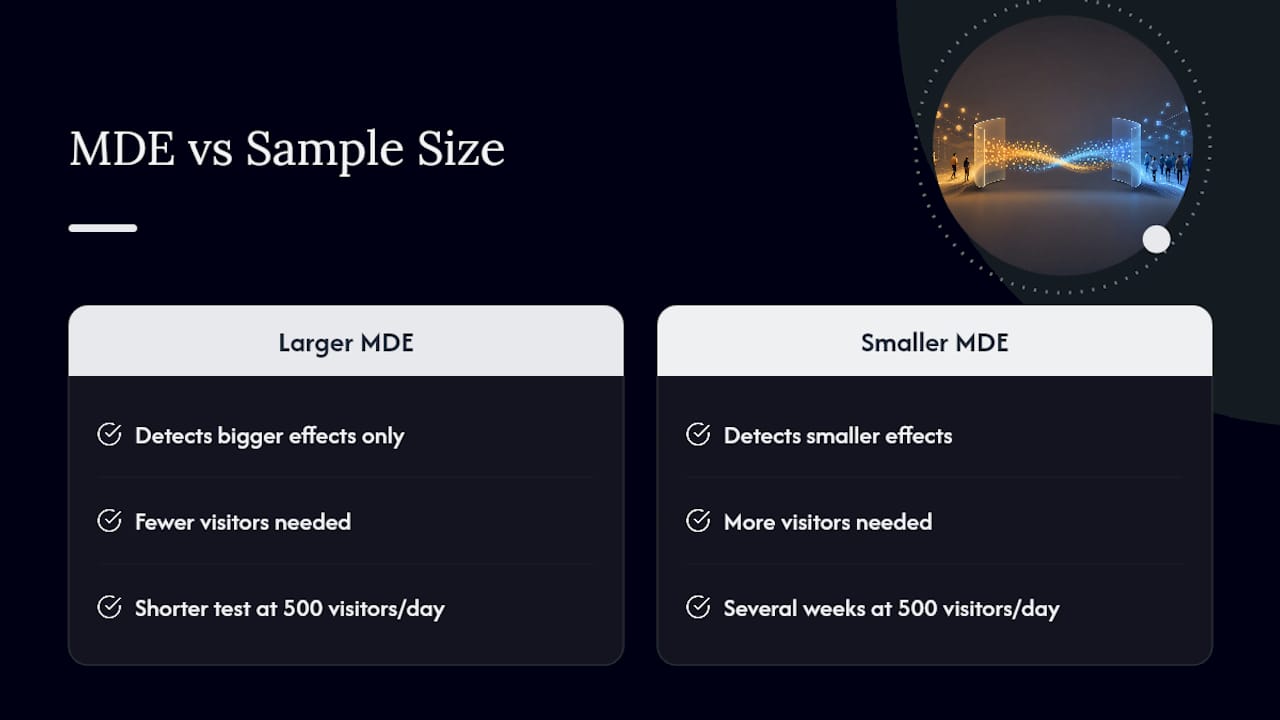
Where p is your baseline conversion rate as a decimal and δ is the absolute MDE (not relative). At a daily traffic of 500 visitors, the test would last several weeks, which illustrates why choosing the MDE carefully is important, which is why MDE choice matters so much.
The trade-off is real: a larger MDE means you only detect bigger effects, so smaller genuine improvements will be invisible. Neither shortcut is free.
For A/B test significance, always run your numbers through a sample-size calculator before you build the variant, not after.
Running the test: randomization, QA, and timing
Randomization is the foundation. Your testing tool must assign each visitor to a variant consistently across sessions. A visitor who sees the control on Monday should not see the variant on Wednesday. Flicker (where the page briefly shows the original before switching to the variant) is both a user experience problem and a data contamination risk.
QA checklist before going live:
- Fire test events in a staging environment and confirm they appear in your analytics
- Verify conversion goals trigger on both variants, not just the control
- Check rendering on iOS Safari, Chrome Android, and desktop Chrome at minimum
- Confirm the variant does not slow page load by more than a measurable threshold
- For split-URL tests, use 302 temporary redirects and point canonical tags back to the original URL. Google Search Central specifies this approach to avoid splitting ranking signals or creating duplicate-content issues.
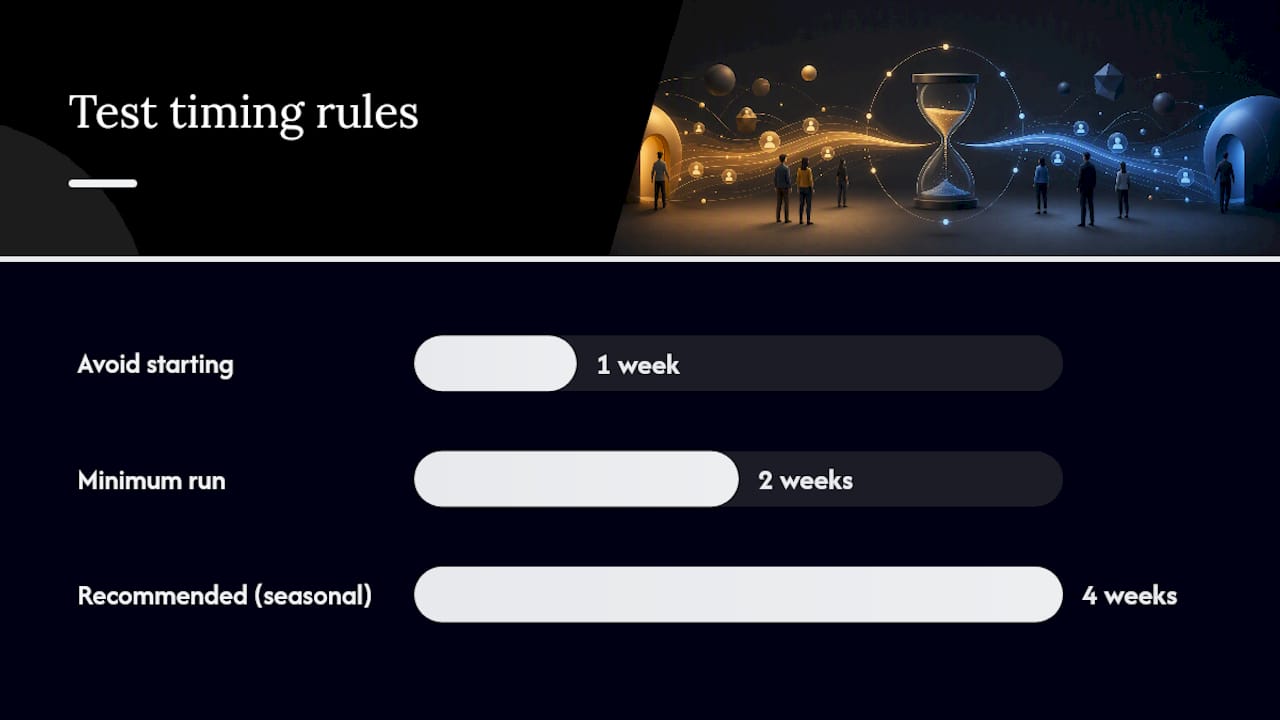
Timing rules: Run for at least two full business cycles, which for most SMBs means a minimum of two weeks. Seasonality and day-of-week behavior can shift conversion rates enough to produce a false winner if you only capture one weekend. Four weeks is better when your traffic has strong seasonal patterns. Never start a test the week before a major promotion or site migration.
Pro Tip: Set a calendar reminder for your end date the moment you launch. The most common source of false positives is stopping a test early because interim results look promising. Commit to the pre-calculated duration and do not touch it.
What to do when you don't have enough traffic
Low traffic is the most common reason A/B testing fails at SMBs, and the fix is not to run the test anyway with a smaller sample. An underpowered test produces results you cannot trust, and acting on them is worse than not testing at all.
A rough practical threshold: if you cannot reach your required sample size within four to six weeks at your current traffic rate, the test is not viable as designed. Your options:
- Increase MDE. Accept that you will only detect larger effects. Focus on high-impact changes (pricing page, hero message, primary CTA) where a 20%+ relative lift is plausible.
- Test higher-traffic pages. Move the experiment to a page with more volume, even if it is not your first-choice optimization target.
- Switch to qualitative methods. User interviews, session recordings, heatmaps, and moderated prototype tests give you directional signal without requiring statistical power. CXL's experimentation guidance recommends qualitative research and heatmaps as the right tool when traffic is too low for reliable A/B tests.
- Run holdout experiments on higher-traffic pages where you can reach significance, then apply learnings to lower-traffic pages.
For low-traffic A/B testing scenarios, qualitative research is not a consolation prize. It often surfaces the insight that makes the eventual test obvious.
How to read results and decide what to do next
Statistical significance tells you the result is unlikely to be random. It does not tell you the effect is large enough to matter. Read p-value and confidence interval together, then check the effect size for practical significance before shipping.
Decision flow:
- Significant result, meaningful effect size: Check guardrail metrics. If guardrails are clean, ship the winner and monitor for two business cycles post-rollout.
- Significant result, tiny effect size: Calculate estimated business impact (lift × monthly traffic × average order value). If the revenue impact is negligible, deprioritize implementation and move to higher-leverage tests.
- Inconclusive result: Document the hypothesis, result, and what you learned. Either refine the hypothesis and re-test, or redirect effort to a higher-impact area of the funnel.
- Significant result with guardrail degradation: Do not ship. The variant won on the primary metric but damaged something downstream. Treat this as a failed test and iterate.
Segment every result by device and traffic source before making a final call. For a deeper walkthrough of analyzing test results by segment, the post-test analysis step is where most teams leave money on the table.
Pro Tip: *Before prioritizing implementation, calculate estimated monthly revenue impact: (lift percentage × monthly conversions × average order value).
Tool and workflow features that make SMB testing reliable
The right tool removes friction from the process without adding performance debt to your site. Features worth prioritizing:
- Lightweight client script. A heavy testing script slows your page before the experiment even starts. Gostellar's script weighs 5.4KB, which keeps performance impact minimal.
- No-code visual editor. Most SMB teams do not have a developer available for every test. A visual editor lets marketers build and QA variants without engineering support.
- Reliable cross-session assignment. Visitors must see the same variant every time. Inconsistent assignment corrupts your data.
- Goal tracking and guardrail dashboards. Built-in event tracking for primary and secondary metrics means you do not need a separate analytics setup for every test.
- Dynamic keyword insertion. For landing page tests tied to paid search campaigns, the ability to match page copy to the visitor's search query adds a personalization layer that static variants cannot replicate.
On the workflow side: maintain a test registry, run a QA checklist before every launch, and share a live dashboard with stakeholders so they are not tempted to call the test early based on a Slack screenshot of interim data.
Pro Tip: Prefer tools that minimize front-end performance impact and provide out-of-the-box guardrail tracking. A tool that slows your page by 300ms is actively harming the experiment it is supposed to measure.
The part most guides skip
Most A/B testing content focuses on the mechanics and skips the harder question: are you testing the right thing? The teams that compound the most learning over time are not the ones running the most tests. They are the ones who spend as much time on hypothesis quality as on test execution.
A weak hypothesis, even run perfectly, teaches you almost nothing. A strong one, even if the test is inconclusive, narrows the solution space and points toward the next experiment. The before/during/after checklist in this guide is not bureaucracy. It is the difference between a test that informs a decision and one that just generates a number.
Gostellar runs tests the way this guide describes
Running defensible experiments without an engineering team used to mean choosing between speed and rigor. Gostellar closes that gap: a 5.4KB script that does not tax your page speed, a no-code visual editor for building variants in minutes, built-in goal tracking for primary and guardrail metrics, and real-time analytics so your team reads the same data at the same time.

There is a free plan for sites under 25,000 monthly tracked users, which covers most SMBs at the stage where experimentation habits are being built. When you are ready to move from guessing to measuring, start your first test on Gostellar and run it the right way from day one.
Sources
The six sources below underpin the guidance in this guide:
- A/B testing (Nielsen Norman Group)
- How to do A/B testing (HubSpot Blog)
- Website A/B Testing: 7-Step Framework for eCommerce - scandiweb
- Google Search Central developer documentation
Recommended
Published: 8/11/2026