
Performance Measurement for SMB A/B Tests That Actually Work
Pick one primary metric tied to your page's job, set your sample size before you launch, and don't call a winner until you've run at least two full business cycles (usually about two weeks). That's the core of solid experiment performance measurement. In practice, it means mapping a single conversion event in GA4 or your experiment platform, defining guardrail metrics like refund rate and churn, and corroborating directional lifts with heatmaps or session recordings when traffic is too thin for textbook significance. Statsig notes that lift is one signal, not the final answer — pair it with statistical checks and downstream impact before shipping anything.
Quick setup checklist:
- Choose one primary metric (signup rate, revenue per visitor, paid conversion rate)
- Set your minimum detectable effect (MDE) and calculate sample size before launch
- Run a minimum of 14 days across at least two business cycles
- Check downstream guardrails (LTV, refund rate, churn) before declaring a winner
- Use heatmaps and session recordings to confirm directional wins when significance is out of reach
Table of Contents
- What performance metrics should you actually measure?
- Do you understand the statistics well enough to trust your results?
- How do you instrument experiments without breaking your data?
- Which experiments should SMBs run first?
- How do you interpret results and roll out winners safely?
- What does a practical SMB measurement stack look like?
- Key Takeaways
- The case for treating lift as a starting point, not a verdict
- Gostellar cuts instrumentation time so you can run more tests
- Useful sources
What performance metrics should you actually measure?
The single most common mistake SMB teams make is tracking everything and deciding on nothing. Pick one primary metric per test — the number that defines "win" for that page's specific job. A lead-gen landing page wins on signup conversion rate. A pricing page wins on revenue per visitor (not raw conversion rate, because a cheaper plan might convert more but earn less). A checkout flow wins on completed purchase rate.
Secondary and guardrail metrics exist to catch unintended damage. If your headline test lifts signups 12% but paid conversion drops 8%, you haven't won — you've attracted worse-fit leads. Track guardrails automatically, not as an afterthought.
| Page type | Primary metric | Guardrail metrics |
|---|---|---|
| Lead-gen landing page | Signup conversion rate | Paid conversion rate, lead quality score, churn |
| Product pricing page | Revenue per visitor | Refund rate, plan mix, average order value |
| Checkout flow | Completed purchase rate | Cart abandonment rate, support tickets, returns |
When revenue is on the line, prefer aggregated metrics like revenue per visitor over raw conversion rate. A variant that converts 2% more visitors but at a 15% lower average order value is a net loss, and raw CR won't show you that.
Do you understand the statistics well enough to trust your results?
You don't need a statistics degree, but you do need to understand four numbers before you run any test: baseline conversion rate, MDE, significance level (alpha), and statistical power. EntrepreneurBytes lays out exactly these four inputs for sample-size calculation — skip any one of them and your test is underpowered before it starts.
The conventional threshold is 95% confidence (p-value ≤ 0.05), meaning a 5% chance your result is random noise. But the p-value alone is a weak signal. Confidence intervals matter more: a lift of +8% with a 95% CI of +1% to +15% is a very different decision than +8% with a CI of +7% to +9%. The first is noisy; the second is precise.
Practical rule of thumb: CRO practitioners recommend a substantial number of conversions per variant for a confident decision, while fewer conversions provide directional confidence that can be supplemented with qualitative insights.
The biggest statistical mistake SMB teams make isn't choosing the wrong metric. It's peeking. Checking results daily and stopping early inflates false positives dramatically — intermittent significance is noise, not signal. Commit to your pre-calculated sample size and run tests for at least two full business cycles before reading results.
Pro Tip: When you need continuous monitoring (think: a high-stakes pricing test), sequential testing or Bayesian methods let you peek without inflating your error rate. Tools like Statsig support these approaches natively.

For low-traffic sites, accepting a larger MDE or moving the test to a higher-traffic page is often the right call. Waiting six months for textbook significance on a page that gets 800 visitors a month is not a measurement strategy.
How do you instrument experiments without breaking your data?
Broken tracking wastes months of effort. Validate before you launch, not after you've already run three weeks of bad data.
Pre-launch QA checklist:
- Verify your pixel or tag fires on every target page (use GA4 DebugView or Tag Assistant)
- Confirm your conversion event fires exactly once per qualifying action — no duplicates
- Run an A/A test for 48–72 hours; if conversion rates diverge significantly, your tracking is broken
- Reconcile your experiment platform's conversion count against GA4 — a 5–10% discrepancy is normal; anything larger needs investigation
- Check for bot traffic and campaign spikes that could skew variant assignment
- Confirm server-side and client-side event counts match for revenue events
GA4 experiments are useful but require manual sample-size verification — the platform won't stop a test early for you, and it won't tell you if you're underpowered. That's your job.
Post-launch, run daily sanity checks for the first 72 hours: total sessions per variant should be roughly equal, and your primary metric should show no sudden spikes that don't match traffic patterns. Set automated alerts for metric drift above 20% in either direction.
Which experiments should SMBs run first?
Headline, hero image, and primary CTA tests consistently deliver 20–30% average lifts on low-traffic sites. Micro-optimizations — button color, footer copy, icon choices — rarely move the needle enough to measure reliably at SMB traffic volumes.
Use a simple two-axis decision matrix: expected impact (relative lift) vs. implementation ease (hours to build). Score each candidate test 1–5 on both axes and run the highest-scoring tests first. Here are six test ideas ranked for SMB teams, from highest to lowest expected impact:
- Headline / value proposition rewrite — the single highest-leverage test on any landing page
- Primary CTA text and placement — "Get started free" vs. "See how it works" can shift intent dramatically
- Hero image or video — social proof imagery vs. product screenshot vs. abstract graphic
- Pricing tier layout — annual vs. monthly toggle, feature emphasis, recommended plan callout
- Form length — removing fields almost always lifts form completion rate
- Simplified checkout — one-page vs. multi-step, guest checkout option
Know when to ship instead of test. A reversible, low-risk fix (fixing a broken mobile CTA, removing a confusing form field) should ship immediately. High-stakes changes — new pricing, a full page redesign, a new offer — need formal testing.
Pro Tip: When traffic is thin, test bigger changes with larger expected lifts. A 5% MDE requires far more traffic than a 20% MDE. Bold variants give you answers faster. See high-impact test ideas for concrete examples.
How do you interpret results and roll out winners safely?
Use a three-outcome playbook. Winner: validate downstream guardrails, then roll out. Loser: roll back, document the learning, and move on. Inconclusive: either iterate with a bolder variant or ship the directional change cautiously if it's reversible and qualitative signals support it.
Post-test validation steps before any rollout:
- Check guardrail metrics (refund rate, churn, returns) over the full test window
- Segment results by new vs. returning users — a variant that works for new visitors may hurt loyal customers
- Flag any 30–90 day LTV signals you can track, especially for subscription products
- Confirm the lift holds across your two largest traffic sources (organic vs. paid, desktop vs. mobile)
Safe rollout checklist:
- Start at 10–20% of traffic to the winning variant
- Hold a 5–10% holdout group at the original experience for continued comparison
- Define rollback triggers in advance (e.g., guardrail metric drops more than 5% from baseline)
- Expand to 50%, then 100%, with a 48-hour hold at each stage
- Document the result, the winning variant, and the guardrail outcomes in your shared test log
When multiple experiments run in parallel, interaction effects are real. The safest rule: don't run overlapping tests on the same page element at the same time. If you must, use mutually exclusive experiment groups and analyze each independently.
What does a practical SMB measurement stack look like?
A lightweight experiment platform plus GA4 plus heatmaps and session recordings plus a shared test log — that's the full stack most SMB teams need. No data warehouse required.
Feature priorities when choosing an experiment platform:
- No-code visual editor (so marketing can move without dev)
- Script weight ≤ 6KB (page speed is a conversion factor)
- Built-in goal tracking tied to your primary metric
- Real-time analytics so you catch tracking failures fast
- Native phased rollout and holdout support
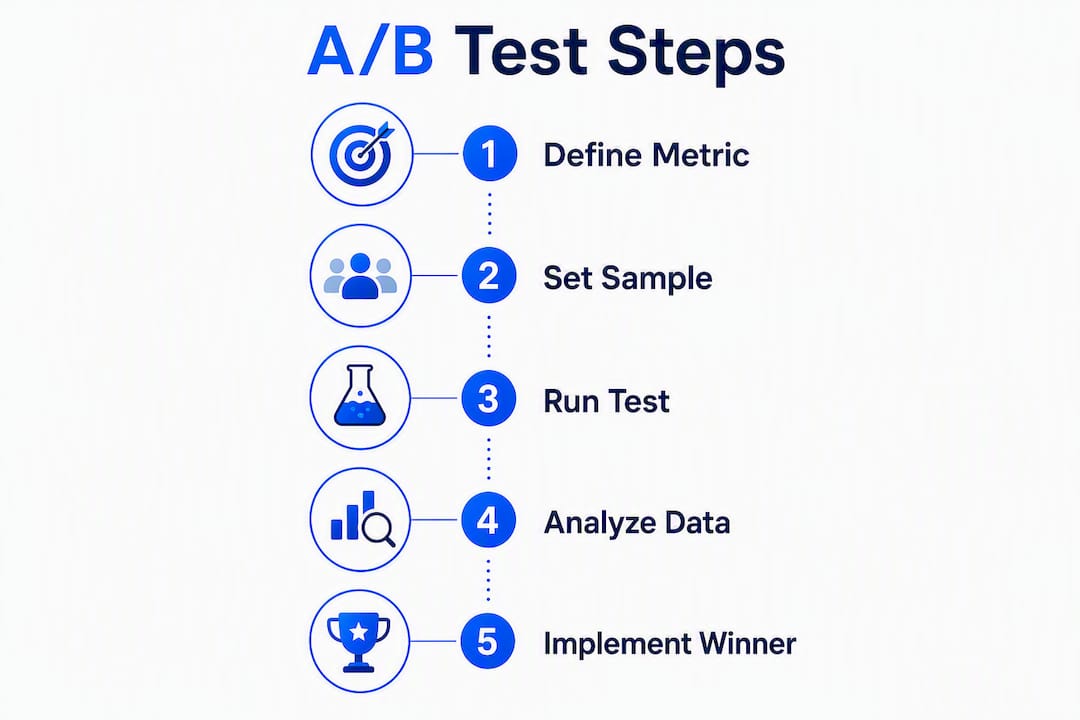
Step-by-step setup workflow:
- Build your tagging plan: list every event you need (page view, CTA click, form start, form complete, revenue event)
- Map your primary metric to a specific tracked event in your experiment platform
- Run the pre-launch QA checklist above
- Launch the test and run daily sanity checks for 72 hours
- At sample size or end of duration, validate guardrails and segment results
- Execute phased rollout per the checklist above
Pro Tip: Variance-reduction techniques like CUPED (Controlled-experiment Using Pre-Experiment Data) can meaningfully increase statistical power without adding traffic. Pre-stratify by major segments (new vs. returning, mobile vs. desktop) before analysis. See A/B testing best practices for implementation guidance.
For team structure: assign one test owner, one analyst (even part-time), and a dev resource on call for instrumentation issues. Run a weekly 30-minute test sync and a monthly review to prioritize the next sprint of experiments.
Key Takeaways
Reliable experiment performance measurement comes down to one primary metric, pre-specified sample sizes, validated tracking, and a three-outcome decision playbook applied consistently across every test.
| Point | Details |
|---|---|
| One primary metric per test | Tie it to the page's job: signup rate, revenue per visitor, or completed purchase rate. |
| Sample size before launch | Use baseline CR, MDE, alpha, and power — aim for 1,000 conversions per variant for confident decisions; 350 per variant can give directional confidence. |
| Run at least 14 days | Two full business cycles smooth weekday/weekend variance and prevent false positives from peeking. |
| Validate instrumentation first | An A/A test and pixel QA before launch prevent weeks of bad data from invalidating results. |
| Gostellar for SMB experiments | Gostellar's 5.4KB script and no-code editor let small teams instrument, run, and measure tests without dev overhead. |
The case for treating lift as a starting point, not a verdict
Most teams I see treat a positive lift number as permission to ship. That instinct is understandable — you ran the test, the number is green, move on. But Statsig's guidance is worth taking seriously: lift is one signal. The teams that get burned are the ones who shipped a 12% signup lift without checking whether those signups converted to paid customers at the same rate.
The more useful mental model is to treat every test result as a hypothesis about downstream behavior, not a confirmed fact about it. A lift in signups is a prediction that revenue will follow. Your job is to verify that prediction before you commit. For SMBs with limited traffic, qualitative corroboration from heatmaps and session recordings isn't a consolation prize — it's often the most efficient evidence available. The teams that move fastest aren't the ones chasing 95% confidence on every test. They're the ones who know exactly when directional evidence is good enough and when it isn't.
Gostellar cuts instrumentation time so you can run more tests
Most SMB teams don't have a measurement problem. They have a setup problem. Instrumentation takes too long, dev resources are scarce, and by the time a test is live, the campaign it was meant to optimize has already ended.

Gostellar's 5.4KB script loads faster than any competing tool on the market, so your page speed stays intact while experiments run. The no-code visual editor means marketing can build and launch variants without filing a dev ticket. Built-in goal tracking maps directly to your primary metric, real-time analytics catch tracking failures within hours, and native phased rollout support means you can execute the safe rollout checklist above without custom engineering.
There's a free plan for sites under 25,000 monthly tracked users. For teams ready to move faster, start your first experiment at gostellar.app.
Useful sources
- Calculating lift in A/B tests: Measuring true business impact — Statsig's guide on pairing lift with statistical checks and downstream business metrics
- Stop Chasing Statistical Significance: The Small Site A/B Testing Playbook — practical prioritization and duration rules for low-traffic sites
- A/B Testing for Non-Technical Founders: From Setup to Analysis — covers sample-size inputs, peeking pitfalls, and qualitative alternatives
- A/B Testing for Small Business: When It Is Worth It — conversion thresholds (350 directional, 1,000 confident) and fixes for underpowered tests
- A/B test significance and decision guidance — practitioner guidance on shipping directional winners with qualitative corroboration
- How to A/B Test Landing Pages and Measure the Winner in GA4 — GA4 experiment setup, limitations, and manual sample-size verification steps
- A/B Testing: How To Run a Statistically Significant A/B Test — Shopify's accessible overview of statistical significance for practitioners
Recommended
Published: 8/1/2026