
Web design test guide: boost conversions efficiently
TL;DR:
- Running a web design test requires precise hypotheses, proper traffic volume, and strict adherence to testing protocols.
- Effective testing involves controlling variables, avoiding early result peeking, and analyzing segmented data to ensure reliable, actionable insights.
Running a web design test sounds straightforward until you are three weeks in, staring at inconclusive data, and realizing your traffic was too thin to mean anything. For marketers and product managers at small to medium-sized businesses, this is a familiar frustration. Bad test setup wastes time, muddies your data, and kills confidence in experimentation altogether. This guide walks you through the exact steps to run a web design evaluation that produces reliable results, from writing your hypothesis to reading the final numbers, without needing a developer on speed dial.
Table of Contents
- Preparing for a successful web design test
- Executing your web design test: step-by-step instructions
- Verifying test results and interpreting data correctly
- Pre-testing prototypes and responsive design checks
- Why many SMB web design tests fail and how to succeed
- Efficient A/B testing solutions to boost your conversions
- Frequently asked questions
Key Takeaways
| Point | Details |
|---|---|
| Calculate sample size first | Always determine the minimum visitors per variant needed before launching an A/B test to ensure reliable results. |
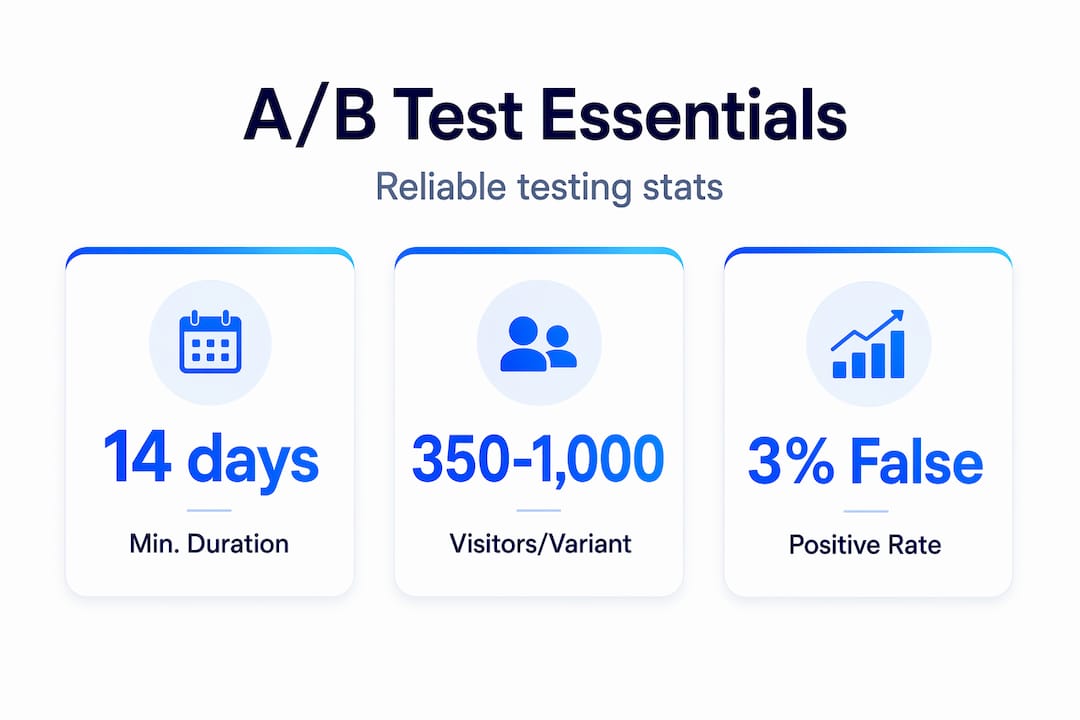
| Run tests minimum 14 days | Tests must run at least two full business cycles to capture realistic user behavior across days. |
| Avoid early result checks | Peeking at results inflates false positives; wait for test completion to analyze data. |
| Segment results | Analyze test outcomes by device and traffic source for accurate implementation decisions. |
| Pretest with prototypes | Use low-fidelity prototypes and responsive checks to catch usability issues before formal A/B testing. |
Preparing for a successful web design test
Before you touch your testing tool, you need to do the work that most teams skip: forming a precise hypothesis. Not "let's try a bigger button" but "changing the CTA button color from gray to orange on the pricing page will increase clicks by 15% because our heatmaps show users are not engaging with the current button." That level of specificity forces you to think about what you are measuring and why, which is the difference between a learning experiment and a random guess.
Variables and hypotheses worth testing
- CTA button copy, color, or placement
- Headline framing (benefit-led vs. feature-led)
- Hero image (product photo vs. lifestyle photo)
- Form length (5 fields vs. 2 fields)
- Social proof placement (above vs. below the fold)
- Navigation structure and menu depth
One variable per test. Always. Testing two elements simultaneously makes it impossible to know which change drove the result. This is the most common error teams make when they start validating marketing ideas for tests and feel impatient to move fast.
Know your numbers before you start
Sample size is not optional math. Effective A/B tests require 350 to 1,000 visitors per variation and at least two weeks of runtime to reach statistical significance. If your page gets 200 visitors a month total, you cannot run a meaningful test there yet. Redirect that traffic to a higher-volume page first, or focus on growing the audience before experimenting.
| Baseline conversion rate | Minimum visitors per variant | Recommended test duration |
|---|---|---|
| 1% | 1,000+ | 4 weeks |
| 3% | 500 | 2-3 weeks |
| 5% | 350 | 2 weeks |
| 10%+ | 200 | 2 weeks |
Performance and compatibility checks matter before you test

Page load time under 3 seconds and compatibility across Chrome, Firefox, Safari, and Edge are baseline requirements before a test goes live. If your variant loads 1.5 seconds slower than the control, you are not testing design. You are testing speed. Slow variants always lose, and that result tells you nothing useful about the design change itself. Run a quick performance check and a marketing automation checklist for SMBs before launch to catch technical gaps that would skew your data. You can also review A/B testing best practices to confirm your pre-launch setup matches proven standards.
Pro Tip: Use Google PageSpeed Insights on both your control and variant URLs before starting the test. If the scores differ by more than 10 points, fix the performance gap first.
With the right preparation in place, you are ready to execute your web design test effectively.
Executing your web design test: step-by-step instructions
Setup is where good intentions often fall apart. Teams rush the configuration, split traffic unevenly, or forget to set an end date. Here is the sequence that keeps your test clean.
- Configure your testing tool to split traffic 50/50 between control and variant. Do not start with 90/10 splits to "protect" your main page. Unequal splits extend test duration significantly and introduce sample ratio mismatch errors.
- Set a fixed end date based on your pre-calculated sample size and duration. Write it down somewhere visible. This is your commitment to the process.
- Define your primary goal before the test goes live: form submissions, clicks, purchases, or scroll depth. Changing the goal mid-test invalidates the results entirely.
- Prioritize your test backlog using the ICE or PIE framework. ICE and PIE frameworks score test ideas by impact, confidence, and ease, which is especially useful for SMBs with limited traffic who cannot afford to run low-value experiments.
- Document the launch date, traffic volumes, any external factors (promotions, seasonality, paid campaigns), and your hypothesis in a shared log. This data becomes invaluable when you are reviewing results.
- Do not touch the test once it is live. No tweaking the variant. No pausing to "check how it is doing." Early peeking is the single most destructive habit in web design evaluation. Checking results prematurely causes false positives that send teams in the wrong direction. Every time you peek and act on early data, you are essentially flipping a coin and calling it science.
Avoid the common A/B testing mistakes that quietly ruin otherwise well-designed experiments. And if you want a deeper look at prioritization and sequencing, the essential A/B testing strategies on the Stellar blog cover the full framework in detail. You can also explore conversion rate optimization techniques to understand what types of design changes historically produce the strongest lifts.
Pro Tip: Block your calendar for the test end date. Treat it like a meeting you cannot reschedule. This removes the temptation to wrap up early when results look "good enough."
Now that you know how to conduct tests properly, let us review how to verify and interpret your results effectively.
Verifying test results and interpreting data correctly
Your test has ended. You have hit your sample size. Now comes the part where even experienced marketers make costly mistakes: reading the data.
What to check first
- Statistical significance at 95% confidence before you declare a winner
- Sample ratio mismatch (each variant should have received roughly equal traffic)
- Novelty effect (a spike in early engagement that fades as visitors get used to the change)
- Segment-level performance, not just aggregate numbers
Segmenting results by device, traffic source, and user type before implementing changes is non-negotiable. A variant that shows a 12% overall lift might be hiding a 30% drop on mobile that the desktop numbers are masking. You would never catch that without breaking the data apart.
Statistical methods: frequentist vs. Bayesian
Most A/B testing tools default to frequentist statistics, which require a pre-set sample size and full test duration. Bayesian testing delivers actionable insights faster than traditional methods, especially useful when your traffic volume is low and waiting 4 weeks is not practical. Bayesian results express probability (e.g., "85% chance this variant beats control") rather than a binary pass/fail, which helps you make informed decisions sooner without the sharp peeking risk of frequentist approaches.
| Metric | What it tells you | Red flag to watch for |
|---|---|---|
| Statistical significance | Confidence the result is real | Below 95% = inconclusive |
| Relative lift | % change vs. control | Small lifts below 5% may lack practical value |
| Sample ratio | Traffic split accuracy | More than 5% imbalance invalidates results |
| Segment performance | Device or source breakdown | Winner overall, loser on mobile |
Pro Tip: Document inconclusive tests with the same rigor as winners. A test that shows no difference is telling you that element does not matter to users, which is genuinely useful information for future prioritization.
You can find a complete breakdown of how to master web testing techniques on the Stellar blog, including frameworks for building a structured testing program over time. Understanding your test results leads naturally into ensuring your web designs are tested thoroughly before A/B experiments begin.
Pre-testing prototypes and responsive design checks
A/B testing is expensive in time and traffic. The smarter move is to catch obvious design problems before a test ever runs, using prototype testing and responsive design checks.
Prototype testing basics
Low-fidelity wireframes tested with 5 to 8 participants in 30 to 60-minute sessions reveal usability problems that you would otherwise discover only after weeks of a failed A/B test. You do not need a polished design. A rough wireframe in Figma or even a paper sketch can expose navigation confusion, unclear CTAs, and form friction before a single line of code is written.
Here is a quick process to run prototype testing efficiently:
- Recruit 5 to 8 participants who match your actual user profile
- Give them a specific task ("find the pricing page and sign up for a free trial")
- Observe without intervening. Note where they pause, click incorrectly, or express confusion
- Debrief with open-ended questions after the task
- Synthesize findings across participants to identify patterns, not individual quirks
- Revise the design before moving to a high-fidelity version
Responsive design and accessibility checks
Responsive tests should confirm no horizontal scrolling, readable text at default zoom, and tap targets larger than 44x44 pixels across all major device sizes. These are not nice-to-haves. A mobile layout that forces users to pinch-zoom or hunt for buttons will tank your conversion rate before your A/B test has a chance to tell you anything meaningful.
- Check layouts at 320px, 768px, and 1280px widths as minimum breakpoints
- Verify all images scale correctly and do not overflow containers
- Test keyboard-only navigation to catch accessibility gaps that automated tools miss
- Confirm form inputs are large enough to tap without zooming on iOS and Android
- Look for text that becomes unreadable against background colors at smaller sizes
Pairing these checks with the boost website UX strategies covered in the Stellar blog gives you a complete pre-launch framework that makes your eventual A/B tests far more likely to produce clear, actionable results. With solid prototype testing done, you are equipped to launch A/B tests knowing your designs offer great usability and responsiveness.
Why many SMB web design tests fail and how to succeed
Here is what we have seen consistently: the biggest predictor of a failed A/B test is not bad design. It is impatience.
Peeking at results early raises false positive rates to 20 to 30%, meaning nearly a third of "winning" tests that teams act on prematurely are statistical noise dressed up as insight. Teams implement changes based on those false positives, see no real improvement, and conclude that A/B testing "does not work for us." The problem was never the methodology. It was the discipline.
The second failure pattern is ignoring segments. An overall winner that loses on mobile is not a winner. It is a mixed result that requires deeper analysis before any rollout decision. Most SMBs skip segmentation because it feels like extra work. It is actually the work.
A/B testing is a statistical experiment, not an opinion poll about design preferences. The teams who win consistently treat it that way: they set sample sizes upfront, they do not touch the test mid-run, and they document every result regardless of outcome. That documentation is what separates a testing program from a series of disconnected guesses.
Underestimating traffic requirements is the third common failure. A page that gets 300 visits a month cannot support a two-week test with statistical integrity. The honest answer is to build traffic before testing, focus on higher-volume pages first, or use Bayesian methods that work with lower sample sizes. Pretending a small sample is sufficient is how you end up making expensive design decisions based on the behavior of 40 people.
Check the common mistakes CRO marketers miss to audit your current testing program against these failure patterns. The good news: once you identify which pitfall is tripping you up, the fix is usually straightforward.
Efficient A/B testing solutions to boost your conversions
Understanding what makes a web design test work is half the battle. The other half is having a tool that does not make the process harder than it needs to be.

Stellar's A/B testing platform was built specifically for marketers and product managers who need reliable experimentation without engineering dependencies. The no-code visual editor lets you set up design variants in minutes. Traffic splitting, sample size guidance, and real-time analytics are built in so you can follow the exact methodology in this guide without stitching together three different tools. The 5.4KB script means your variants load as fast as your original page, removing the performance variable that contaminates so many tests. Stellar's free plan covers up to 25,000 monthly tracked users, so you can start testing immediately. Review the A/B testing best practices on Stellar blog and use the platform to avoid common A/B testing mistakes from your very first experiment.
Frequently asked questions
How long should a web design A/B test run for reliable results?
A/B tests should run for a minimum of 14 days or one full business cycle to account for day-of-week behavior patterns and to accumulate enough visitors for statistical significance. Ending earlier almost always produces unreliable data.
What sample size do I need for my web design test to be statistically significant?
Effective tests require 350 to 1,000 visitors per variant depending on your baseline conversion rate and the minimum detectable effect you care about. Lower baseline rates require more traffic to detect meaningful differences.
Why is it important not to peek at my test results before completion?
Peeking early inflates false positive rates to 20 to 30%, which means you risk shipping design changes that look like winners in early data but produce no real conversion lift once fully deployed.
How can prototype testing improve my A/B test outcomes?
Testing wireframes with 5 to 8 participants reveals usability problems before you invest traffic in a formal A/B test, ensuring the variants you eventually test are already solid in terms of navigation and core usability.
Should I segment my test results by device type?
Yes. Segmenting by device and traffic source is essential because a variant that wins overall can simultaneously hurt mobile conversions, and rolling it out site-wide without segmenting would reduce your overall revenue despite the aggregate "win."
Recommended
Published: 5/14/2026