
A/B Testing Teams: Run a Website Tracking Check in Minutes
A website tracking check passes when every expected event fires with the correct name and parameters, each user triggers exactly one exposure event per experiment, and the analytics platform confirms receipt in real time through DebugView or an equivalent live stream. If any of those conditions fail, run the quick checklist below before touching code. A platform like Gostellar can shorten the loop between spotting a broken event and shipping the fix.
TL;DR:
- Confirm the tracking snippet loads with the correct measurement ID to prevent data misdirection and downstream errors.
- Use DebugView and Tag Assistant together to identify discrepancies between sent and received events, focusing on ID mismatches and ad blockers.
- Verify event payloads for correct names, parameters, data types, and order, ensuring no duplicates or missequenced events compromise data integrity.
- Check server-side events by confirming valid identifiers, proper payload structure, and real-time visibility in DebugView or Realtime reports.
- Automate tracking schema validation and build a rigorous QA matrix in CI/CD pipelines to catch regressions before they reach production.
Table of Contents
- What should you check first in a website tracking check?
- How do DebugView and Tag Assistant work together?
- Are your event names, parameters, and order actually correct?
- How do you verify server-side and Measurement Protocol events?
- What does a real experiment QA checklist look like?
- Can you automate tracking checks in CI/CD?
- What's the fastest way to troubleshoot a tracking failure?
- Do ad blockers and privacy settings quietly break your data?
- How do you confirm consent settings aren't blocking your events?
- How do you validate tracking across devices and domains?
- Should you use RUM and synthetic monitoring for tracking health?
- How do you protect tracking during a site redesign?
- Author's perspective: what actually saves time
- Run experiments faster with fewer tracking headaches
- Primary sources and tools to keep open while you check
- Sources
What should you check first in a website tracking check?
Start with the fastest signals, not the deepest ones. You're triaging, not auditing.
- View page source and confirm the tracking snippet loaded, along with the correct measurement ID. A wrong ID sends data to the wrong property, and everything downstream looks broken even though it isn't.
- Open DevTools, go to the Network tab, and filter for your analytics endpoint. Confirm each request returns a successful status, not just that it was sent.
- Open GA4 DebugView and trigger the action on a debug device. You should see the event land within seconds.
- Use Tag Assistant to decode the outgoing payload and check it matches what you expect.
- Scan the Console for JavaScript errors. A single thrown error earlier in the page can silently block every tag that loads after it.
- For any live A/B test, confirm that the exposure event fires exactly once before you check anything else.
For a deeper walkthrough of the DevTools side, the Chrome DevTools guide covers request inspection in more detail.
How do DebugView and Tag Assistant work together?
They answer two different questions, and confusing them wastes hours. Tag Assistant tells you what the browser actually sent. DebugView tells you what Google Analytics actually received. The gap between those two answers is where almost every tracking bug lives.
- Turn on
debug_modeand watch the Seconds or Minutes stream in DebugView for your test events to appear. - Cross-check the decoded payload in Tag Assistant, looking specifically at parameters like
tid(tracking ID) andep.*(event parameters). - If Tag Assistant shows the request left the browser but DebugView shows nothing, suspect a measurement ID mismatch, the wrong debug device selected, an ad blocker stripping the request, or a consent banner blocking collection before the event fires.
Standard GA4 reports take 24 to 72 hours to fully process data, which is exactly why DebugView exists. If you wait for the standard report to confirm a fix, you'll spend two days chasing a bug that DebugView could have ruled in or out in under a minute.
Are your event names, parameters, and order actually correct?
A tag that "fires" isn't the same as a tag that fires correctly. Plenty of broken experiments show green checkmarks in Tag Assistant right up until someone opens the payload and finds the event name misspelled or a parameter carrying the wrong data type.
- Open the decoded payload and confirm the event name matches your naming convention exactly, including case, and that every required parameter is present.
- Check numeric fields and currency units specifically. A backend sending cents while GA4 expects dollars produces a 100x scaling error that quietly wrecks revenue reporting for weeks before anyone notices.
- Look for duplicates: the same user firing the same event twice within about a second usually means a double-bound listener or a re-rendered component, not two real actions.
- Confirm ordering. An exposure event that lands after its matching conversion event breaks the causal read of the experiment, even if both events technically fired.
Pro Tip: Save a HAR file or a screenshot of the decoded payload every time you sign off on a tracking check. Six weeks later, when someone questions the data, you want proof in hand, not a memory of what DevTools showed.
The web analytics guide walks through more of these implementation errors if you want the full diagnostic list.
How do you verify server-side and Measurement Protocol events?
Client-side checks only cover what happens in the browser. Server-side events, sent through the Measurement Protocol, need their own verification pass because a payload that looks fine in your code can still fail silently on arrival.
- Confirm you have a valid
app_instance_idor another identifier the property already recognizes. An unrecognized identifier is the single most common reason a server-side event vanishes without an error. - Send one test event through the Measurement Protocol, then check both Realtime and DebugView for its arrival, per Google's own verification guidance.
- If it doesn't show up, check for the usual suspects: a malformed payload structure, an identifier tied to the wrong property, or a request silently targeting a staging endpoint instead of production.
- Screenshot the request and the DebugView result together. That pairing is your evidence the server-side pipeline works end to end.
Reproduce the failure once you find it, on staging if possible, before you hand it to engineering. A bug you can reproduce on demand gets fixed in an afternoon; one that "sometimes happens" can sit open for a month.
What does a real experiment QA checklist look like?
Before any A/B test goes live, freeze the hypothesis, the primary metric, and the exact experiment and variation IDs you'll be checking against. Changing any of those mid-flight invalidates the comparison, even if the tracking itself is flawless.
Build a small matrix instead of relying on memory: test case, device, environment, expected event, evidence artifact, owner, and status. It doesn't need to be elaborate. A shared spreadsheet with six columns catches more bugs than an ad hoc Slack thread ever will, because it forces someone to actually check the box rather than assume it's fine.
- Validate the exposure event payload for every variation, not just the control.
- Confirm the conversion event fires on every trigger path a real user might take, including edge cases like browser back-button navigation.
- Never trust the platform's preview mode as proof. Preview often renders the experience without sending the live analytics POST request, so it can pass visually while telemetry stays completely silent.
- Reconcile your analytics dashboard against the experiment platform's own results page before you call the launch clean.
Pro Tip: Require a captured payload screenshot before anyone signs off on a launch. "I checked it in preview" is not evidence. The Google A/B testing guide has more on structuring this kind of pre-launch verification.
Can you automate tracking checks in CI/CD?
Yes, and you should treat your event schema the same way you treat an API contract. Once tracking regressions happen silently after a deploy, someone eventually notices a week of missing conversion data, and by then the damage is done.
- Store the event schema in your repository and run a contract lint on every push. This catches a renamed parameter or dropped field before it ever reaches production.
- Write snapshot tests that assert the exact sequence of events a given user flow should emit, and fail the build when that sequence drifts.
- Add a staging smoke test that fires your canonical events against a staging API key and asserts a 2xx response before allowing a merge, a pattern laid out well in analytics CI/CD testing guidance.
- Wrap your analytics SDK so tests can inject mock calls, and schedule a recurring production health check that fires a low-volume canary event and alerts if it stops arriving.
What's the fastest way to troubleshoot a tracking failure?
Work through causes in order of likelihood, not alphabetically.
- Nothing fires at all: check that the tag is actually present in page source, scan Console for blocking errors, confirm GTM Preview shows the trigger firing, and double-check the measurement ID.
- It fires locally but never arrives: verify the measurement ID again, confirm you selected the right debug device in DebugView, and rule out network-level blocking from an extension or firewall.
- It shows in DebugView but never reaches standard reports after 48 hours: check for active data filters on the property and remember that standard processing can lag behind Realtime by design.
- Collect a HAR file or screenshot and reproduce the issue on staging before escalating. An engineer can fix in ten minutes what took you two hours to diagnose, but only if you hand them evidence instead of a description.
Do ad blockers and privacy settings quietly break your data?
They do, and the effect is bigger than most teams assume. Ad blockers and browser privacy features like Safari's Intelligent Tracking Prevention or Firefox's Enhanced Tracking Protection routinely block analytics requests before they ever reach the network tab, which means a percentage of your real traffic never shows up in any report at all, no matter how correctly your tags are configured.
This creates a specific trap during a tracking check: you test on your own browser, which likely has an ad blocker installed for your own daily browsing, and everything looks broken when the tracking is actually fine. Always run your verification pass in a clean browser profile with no extensions before concluding a tag is broken.
The practical impact varies by audience. A B2B SaaS site with a technical visitor base can lose a meaningfully higher share of pageviews to blocking than a general consumer site, because developers and privacy-conscious users install blockers at far higher rates. If your conversion numbers look inexplicably low compared to what your CRM shows, blocked tracking requests are a more likely explanation than a broken funnel.
You can't recover 100% of blocked data through client-side fixes. Server-side tagging, where events are relayed through your own domain instead of a third-party endpoint, recovers some of it, but it also introduces its own consent and configuration checks that need the same verification discipline as any other tracking layer.
How do you confirm consent settings aren't blocking your events?
Consent management is now a tracking dependency, not just a legal checkbox. Under GDPR and CCPA, analytics and experimentation tags typically can't fire until a user has granted the relevant consent category, and most consent management platforms implement that by holding tags in a queue or blocking the request outright until the visitor makes a choice.
That queueing behavior is a common, and commonly missed, source of "missing" data. If your consent banner defaults to denying analytics consent, and a large share of visitors never interact with the banner at all, your DebugView stream can look sparse even though nothing is technically broken. Test both consent states deliberately: accept, and decline, then confirm your tags behave correctly in each case rather than assuming the accepted path is the only one that matters.
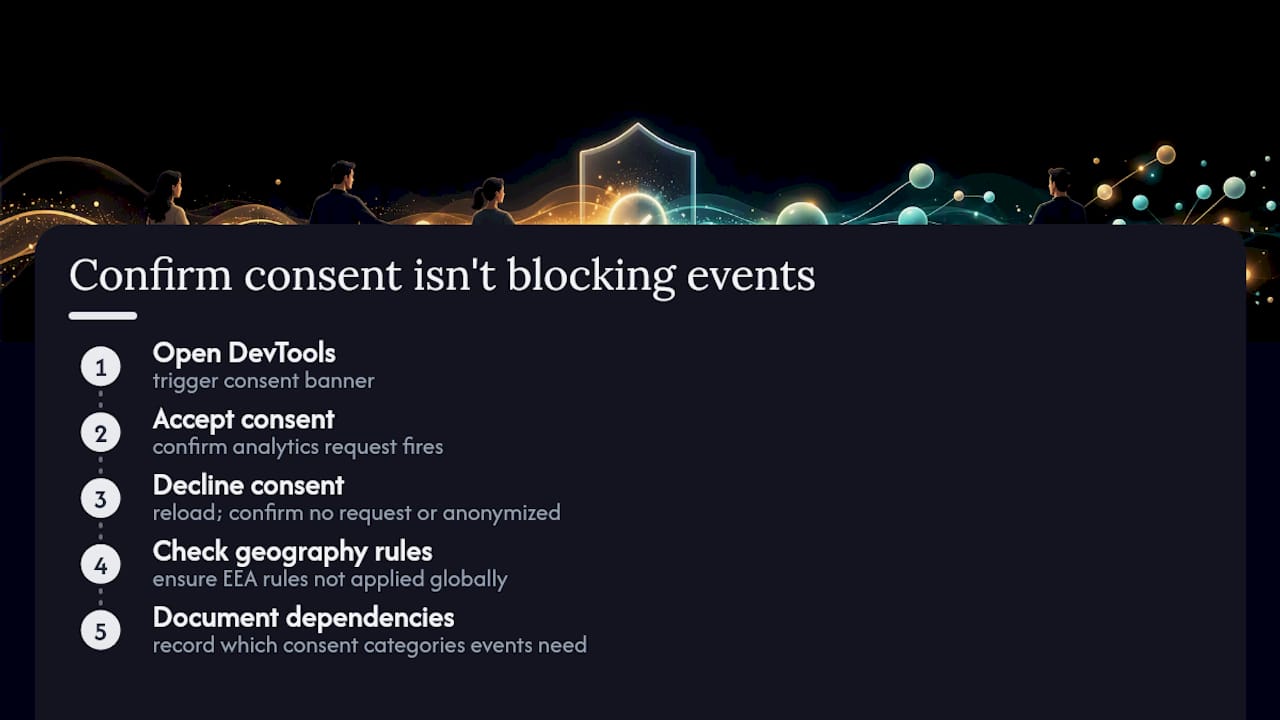
Verify the mechanics directly. Open DevTools, trigger the consent banner's accept action, and confirm the analytics request fires immediately afterward with the expected parameters. Then reload, decline consent, and confirm the request either doesn't fire or fires in a properly anonymized, consent-respecting mode, depending on how your consent platform is configured. A geographic mismatch here, where a consent rule written for European Economic Area visitors is accidentally applied globally, will suppress far more data than intended.
Document which consent categories your tracking and experimentation events depend on. When a stakeholder asks why traffic from a specific region looks lower than expected, that documentation is the difference between a two-minute answer and a week of speculative debugging.
How do you validate tracking across devices and domains?
Cross-device and cross-domain tracking fail in ways that single-page checks never surface, because the problem only shows up when a real user's session actually spans two contexts.
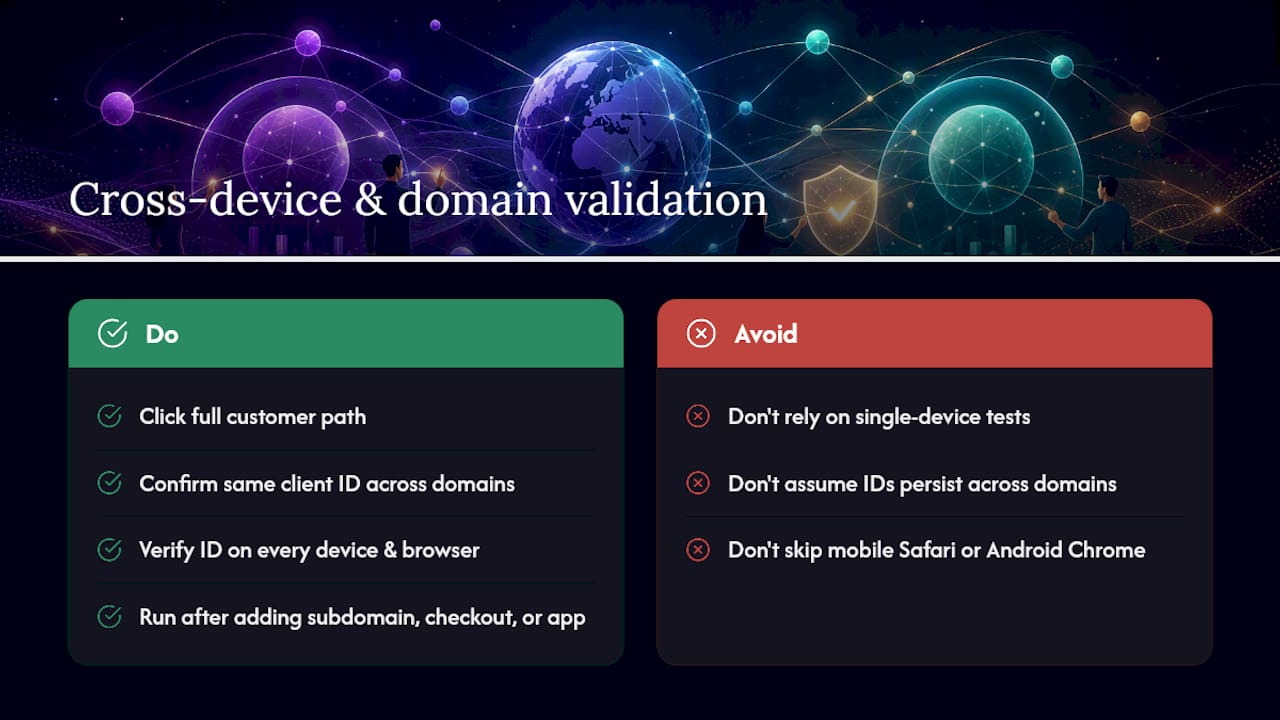
Cross-domain tracking breaks most often when a user moves from a marketing site on one domain to a checkout or app experience on another, and the linking parameter that ties the two sessions together gets stripped somewhere in the handoff. Test this by manually clicking through the exact path a customer would take, from the original domain to the destination, and confirming the same client ID or user identifier persists across both DebugView streams. If the ID resets, your funnel and attribution data will show two disconnected sessions instead of one continuous journey.
Cross-device validation is harder to test directly since you can't force a single person to use their phone and laptop in the same session on demand. The practical substitute is confirming your identity resolution method, whether that's a logged-in user ID, a hashed email, or a platform-specific solution, is actually being passed into every relevant event, on every device, not just the primary one your QA team happens to test on. A test matrix that only ever runs on a work laptop in Chrome will miss the mobile Safari and Android Chrome combinations where most real cross-device gaps show up.
Run this validation any time you add a new subdomain, a new checkout provider, or a new mobile app view. Each one is a fresh place for the identifier handoff to quietly break.
Should you use RUM and synthetic monitoring for tracking health?
Real user monitoring and synthetic monitoring solve two different blind spots, and a mature tracking check uses both rather than picking one.
Real user monitoring (RUM) captures what's actually happening in production, across every browser, device, and network condition your real audience uses. It's the only method that will catch a tracking failure specific to one browser version or one region's network configuration, because it's built from live traffic rather than a fixed test script. The tradeoff is that RUM is reactive: you find out about a failure after real users have already been affected.
Synthetic monitoring runs a scripted sequence, load the page, click the button, confirm the event, on a fixed schedule from a controlled environment. It won't catch the exotic real-world edge cases RUM will, but it catches a dead tag within minutes of a bad deploy rather than hours or days after someone happens to notice the dashboard looks light. A synthetic check that fires a canonical event every 15 minutes and alerts on a missing response is one of the cheapest insurance policies available against a silent tracking outage.
Neither replaces manual verification during an active launch. Both are what keeps tracking healthy in the gaps between launches, when nobody is actively watching DebugView and a routine deploy is exactly the kind of moment where a tag quietly stops firing.
How do you protect tracking during a site redesign?
Redesigns and platform migrations break more tracking implementations than any other single event, because the tags are usually the last thing anyone thinks about until launch week.
Inventory every tag, pixel, and event listener on the current site before a redesign starts, not after. It's far easier to confirm parity against a known list than to guess what might be missing once the new site is already live. Treat this inventory as a checklist item in the project plan, with an explicit owner, the same way you'd treat any other launch dependency.
Stage the new implementation on a staging environment and run the full quick checklist, DebugView, Tag Assistant, Console errors, before the redesign goes anywhere near production traffic. A redesign that changes DOM structure or class names will silently break any tracking that relied on CSS selectors instead of stable data attributes, and that failure mode won't show up until real users start clicking around.
Keep the old and new tracking configurations running in parallel for a short window after launch wherever the platform allows it, so you can compare event volume and catch a drop before it costs you a full reporting cycle. Version your tracking configuration in the same repository as your site code when possible, so a rollback of the site also rolls back the tracking, rather than leaving a mismatched pairing that quietly corrupts data for days.
Author's perspective: what actually saves time
The teams that avoid tracking disasters aren't the ones with the most sophisticated tools. They're the ones with the most boring discipline: no sign-off without a captured payload, no experiment launch without a filled-in QA matrix, no "it worked in preview" accepted as proof of anything.
Use allowlisted test accounts and a controlled traffic ramp so early problems surface on a handful of sessions instead of your full audience. Version the experiment configuration alongside the code, and write down every accepted limitation instead of letting it live in someone's memory. None of this is clever. It's just consistent, and consistency is what most broken tracking setups are actually missing.
— Juan
Run experiments faster with fewer tracking headaches
A lightweight setup catches fewer tracking bugs simply by having less surface area for something to break. Gostellar ships a 5.4KB script, which keeps page load impact low and reduces the number of places a tag conflict or blocked request can hide compared to heavier, feature-bloated testing scripts.

The no-code visual editor means your team can set up and verify a variation without waiting on a developer to hand-code a tag, and the built-in goal tracking and real-time analytics dashboard shorten the gap between spotting a broken conversion event and confirming the fix worked. For small and mid-size teams running frequent experiments, that shorter verify-and-fix loop matters more than any single feature on a spec sheet. If you want a platform built to make that loop fast, start with Gostellar's A/B testing tools and run your next experiment with verification built into the workflow instead of bolted on after launch.
Primary sources and tools to keep open while you check
Keep these open in a tab while you work through a check: Google's GA4 troubleshooting and DebugView documentation, the Measurement Protocol verification guide, Tag Assistant, your browser's DevTools Network panel, and an experiment QA checklist for pre-launch sign-off. For a broader look at why accurate data matters beyond experimentation, the analytics for SaaS growth guide is worth a read.
Sources
- Troubleshoot Google Analytics installations (GA4)
- How to Debug GA4 Events: DebugView and Tag Assistant
- Optimizely Experiment QA Checklist: Validate Before Launch | OptiPilot
- Analytics in CI/CD: Automated Event Validation
Recommended
Published: 8/27/2026